
Soil & Plant Analysis
On this page I will discuss our approach to soil and plant analyses at Lill-Nägels.
Each year will have its own subpage. 2022's subpage is essential reading as it compares and contrasts the results of our soil sampling with the conceptual background of the project. Future soil analyses will have the benefit of prior soil samples for making comparisons.
Subpages will be updated with soil and plant analyses from Lill-Nägels as they become available.
Our system rests upon the idea that diverse plant communities build healthy soil primarily through establishing and maintaining complex relationships with soil organisms. Soil is a living ecosystem: soil is the result of biology interacting with geology. It used to be believed that soil formed over very long timespans and could not be greatly altered through management. This idea is now outdated in our opinion. Changes can occur quite quickly, for example, soil aggregates require constant renewal by biology- remove the input of root exudates feeding fungi and bacteria and these important structures can degrade in about one month. These changes are not insignificant from the farmer's perspective, nor from assessing the ability of the soil to support an ecosystem.
Understanding that any single measure of the soil gives us a snapshot of a complex system, we have planned to take groups of different soil tests throughout the growing season. There are many ways to measure soil health and sometimes the results (or, perhaps, more precisely the interpretation of the results) can be ambiguous or even contradictory. This is why we are using multiple measurement and observation methods to try putting together a more holistic picture, or puzzle, of the soil at Lill-Nägels. Our idea is that over time we will ideally be able to correlate management with changes to the soil and, perhaps, reveal patterns of nutrient availability or scarcity. If there are clear patterns arising it could be possible to create protocols which can help farmers act on what they see without necessarily having the laboratory data.
What kinds of tests are we doing at Lill-Nägels?
For our project we want to use methods that are familiar to farmers, but increase their frequency to provide more data. Here I will briefly discuss each kind of test we are doing and include some of the disadvantages we see, which helps explain why we need more information to make better choices.
Conventional Soil Testing (with micronutrients and reserves)
This is often known as "chemical" soil analysis as the extraction methods focus on testing the chemistry and physical properties of the soil and not the biological activity. These types of tests are the standard in agriculture and are legally required by farmers to monitor nutrient loads. Because these tests do not examine biology in detail, farmers practicing regenerative agriculture often augment these laboratory assessments with other methods. We have decided to include these tests because they are the kinds of results that farmers are used to reading, thus serving as a good starting point for discussing the other tests.
One disadvantage of how the results are sometimes presented is that soil organic matter is reported to the farmer with a category that refers to a range of percentage points. The "range" of soil organic matter (SOM) readings is very large: the floor of one classification can be half of the ceiling. The difference between, say, 3% and 5,9% SOM is non-trivial; for every 1% increase in SOM it is estimated that you can add an additional 150,000 liters of water holding capacity per hectare. The difference between the two, using this average, is an additional 450,000 liters of water holding capacity per hectare! I think that the soils at either end of the range need to be managed differently from one another. Lastly, if we consider adding 0,5-1% SOM per season as an accomplishment, a farmer might take anywhere from 3-6 years (at least) to transition from one end of that range to the next. Presenting SOM as a range masks progress or regression towards improving organic matter on their operation.
Near Infrared Spectroscopy (NIR) Soil Testing
This is a (relatively) newer method and is not accepted in place of conventional soil testing for meeting legal requirements. It has been added to the available analyses, in part, because the test can measure soil organic matter and soil biology with greater precision. The laboratory offering these tests cautions farmers against directly comparing the results from the conventional tests to the NIR. We have chosen to include NIR testing because we would like to have laboratory analysis of the soil organic matter as well as nitrogen readings- which are very useful for understanding soil health, not withstanding the importance as a nutrient for crops. The report also contains many other interesting bits of information about the sample, everything from soil structure and wind erosion resistance to a water retention curve.
One of the biggest drawbacks of this test is that the accompanying interpretation scale, which reads from poor to high, can give some very odd results. For example, microbial biomass measures can be rated as "good" even though direct observation of the soil profile, plants, and microscope surveys of soil life reveal extremely low levels of soil biological activity. The very same NIR test reveals a SOM of only 3,3%, which is poor. So, like with any soil test, it is very important that the results and interpretations are made with a holistic understanding of the sample itself as well as agroecology.
Soil Food Web Analysis
This analysis involves soil being directly observed under a microscope by a technician trained in identifying, quantifying, and analyzing soil microbiology. You could think of it as a "census" of the soil sample. Care must be taken, like with every single one of these tests, not to extrapolate the results too far. Discrepancies between direct observation through the microscope and the reports from the NIR test are especially interesting. We have decided to include this test because we want to have direct observation of the microbes to compare with the NIR laboratory technique as well as the proxy indicators of soil health (see the section On Farm Testing, below). In addition, direct observation with a microscope allows us to tell what kinds of microbes are there, which is something that the NIR test does not do.
One thing to always keep in mind with this kind of analysis is that the life cycle of microbes can be measured in hours (sometimes minutes); therefore the samples absolutely need to be analyzed as soon as possible once they are taken. Even the NIR testing reveals the effect of time: samples that are retested have less microbial activity than the initial sample.
A possible challenge for many farmers is that the Soil Food Web analysis does not include nutrient recommendations, but instead focuses on what a farmer could to do improve the soil food web's function.
Plant Sap Analysis
This kind of analysis is not especially new either, but is gaining popularity with farmers practicing adaptive management who wish to support soil biology. Tests are conducted during the growing cycle of the plant. The farmer sends both old and new leaf material of the target crop to a laboratory on a regular basis (2-3 week intervals). The lab then extracts the sap of the plant and provides a list of nutrients and their quantity.
The difference between the nutrient readouts from the old and new leaves (as well as damaged or irregular, but not diseased) can tell you what nutrients are actively being mobilized by the plant. If nutrients appear in sufficient quantity in old leaves, for example, but are deficient in new leaves (or vice versa) then you can begin to question why the plant is not able to provide the new growth with what it needs.
Performing this test every two to three weeks during the growing season allows the farmer to make adjustments in plant care, based on measurements, and then verify the absorption or mobilization of those nutrients with the next set of leaves sent to the lab. Interestingly, it is often reported that nutrients which a conventional soil analysis says are available in sufficient quantity do not find their way into the plant sap. The inference is that soil analysis may not correlate with what the plants are actually using. When the deficiencies discovered by sap analysis are addressed, growers report that the crops improve. This should be a very interesting set of data.
A major downside to sap analysis is cost: it takes both sufficient monetary resources, as well as time to properly take and send the samples to the lab. Therefore this is usually only done with high market value crops that can leverage the information gathered. We are planning to use sap analysis in order to:
- find discrepancies and agreements between the soil analyses (conventional and NIR)
- address nutrient deficiencies through foliar feeding
- find out whether patterns of nutrient availability and deficiencies emerge
On Farm Testing
Last but not least, this package of tests is available to anyone with simple tools and some water. These tests offer the farmer protocols with which to engage in direct observation of soil, plants, animals, fungi, as well as the consideration of proxy indicators of microbiological activity.
The tests are:
- Field observation
- Date, weather current and preceding by a week or so
- General observation of field's state
- Soil profile location observation
- What is growing there?
- What does the soil surface look like?
- Is it covered?
- Soil profile dug to 50cm
- Notes taken on soil aggregation, rooting depth, earthworm and other macroorganism activities, soil color, soil smell
- Rainfall infiltration simulation
We may begin adding Brix readings to this list as well.
Because they are based on observation and can be conducted by anyone, "results" vary widely. Many good attempts have been made to provide more structure for these tests, especially by researchers needing comparable data. However, the main drawback I see in these attempts at standardization is that they can present yet another barrier to entry for farmers who don't want to "do it wrong." Farmers feeling intimidated by industry and academic experts is perhaps more common than we'd like to think.
Creating rigorous guidelines is laudable, but it is not absolutely necessary for the average farmer. The first step to understanding the soil is to actually look at it on your farm, in your context, without pressure that you aren't smart enough to understand what you are seeing. In fact, when soil observation is presented as a tool to help you understand, rather than a rigorous scientific method, one can start learning about the most significant things to look over the course of a single morning and spend the afternoon digging on their farm. It doesn't take more than a willing mind and a few hours to begin the journey. Of course, it helps to have consistency in what you are up to so that you can compare notes within your context.
We want to encourage farmers to actively put what laboratory soil testing says into perspective with the tools they already have. We will conduct these on farm tests in a simple manner because we want to speak in plain language about what we see. The intent is not to replace laboratory or methodical testing, but to give the results context.
Where & when will we sample?
Collecting the data and making observations is important not for the sake of collecting data, but in order to make comparisons. We want to compare the combination of divergent management strategies in the margins, alleys, and tree lines. Summer 2022's samples will serve as the essential baseline against which all subsequent changes are measured. Since our site experienced a strong and persistent drought in 2022, which prevented any changes to the site through bioremediation, the samples we take in the spring of 2023 may also serve as additional baseline samples.
We will take samples in the spring, summer, and fall each year. Spring will correspond with early-mid May in order to allow soil biology to begin working. Our summer samples will be taken late in the season, around mid-late August, when most of the growing season has passed, in order to take a snapshot of how summer's biological activity has altered the system. Lastly, we will sample again in the fall around mid-late November when photosynthesis has come to a halt, to see how the lack of biological activity once again changes things.
Season |
Month |
Sample? |
| Spring | May | Yes; tracks changes that occurred in winter and early spring |
| June | ||
| Summer | July | |
| August | Yes; tracks changes during height of growing season | |
| Fall | September | |
| October | ||
| November | Yes; tracks changes as photosynthesis falls off |
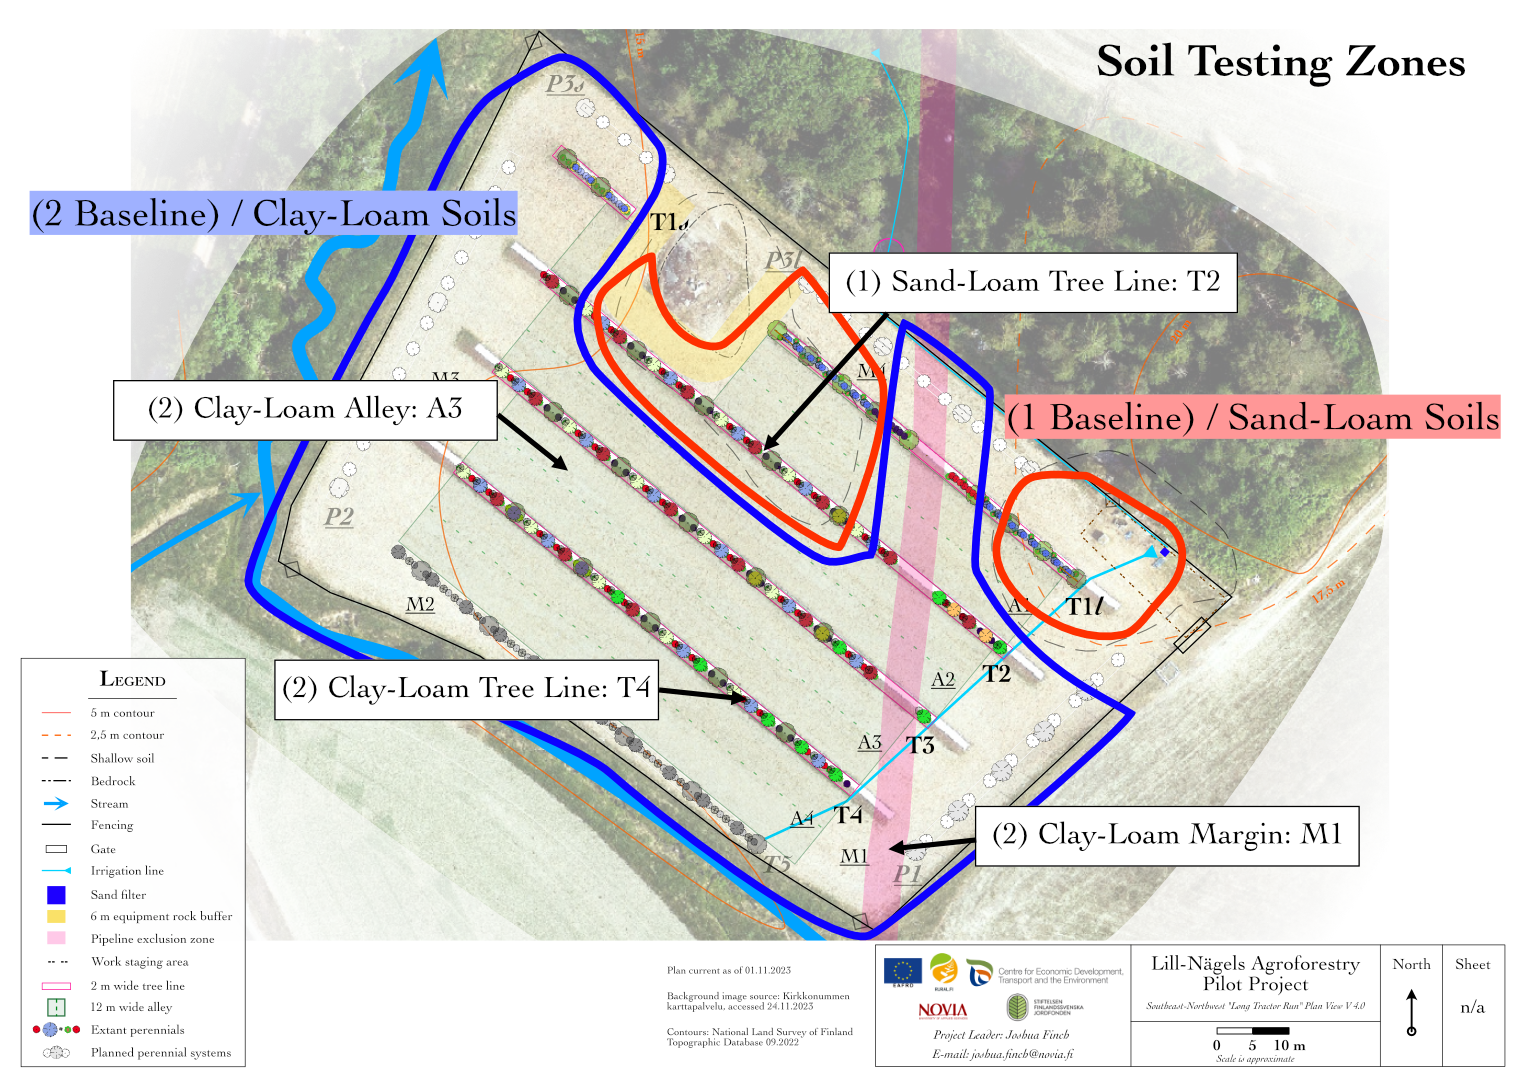
Expectations of Change & Number of Samples per Zone
Margins: 1 sample
The margins of the site are in some sense the closest to a control. By planting the margins with diverse perennial meadow species and managing them as biomass production and habitat spaces, the main changes to this area of the site are increasing biodiversity and foliar applications of nutrients/biostimulants as needed. Samples will be taken from the deeper soil areas of the site and thus provide one (1) sample lineage for now.
Alleys: 1 sample
These will change dramatically as the intention is to return the alleys to growing mostly annual and biennial cash crops. Although we will employ soil health principles and adaptive management, it is quite likely that the alleys will not improve as rapidly as the Tree Lines or Margins. As neither the margins or alleys will receive a mulch layer of compost, they will be most comparable to one another in terms of the lack of outside nutrient importation. Lastly, the alleys largely have deeper soil and do not need to be differentiated based upon soil depth. This will allow us to trace changes in the alleys along a single (1) sample lineage as well.
Tree Lines: 2 samples
If you have followed the Field Information subpages, you will know from analysis and design that the soil is relatively homogenous except for the presence of shallow soil zones. In order to account for these differences, we have designed the polycultures of the tree lines to take into account natural water availability. Although we intend to have a proper irrigation system, agroecological design directs us to ensure that as far as possible we match species with site conditions. Higher on the site, where the shallow soils are more prevalent, we have mixes of species that should perform better in dry conditions. As you travel down the slope towards the stream, the soils become deeper, heavier, and wetter.
Therefore we want to track changes in the soil by the dominant polyculture planted in them. That means the tree lines will provide two (2) sample lineages to trace during the duration of the project.
We expect to see the most rapid changes in soil health under the tree lines, with the polycultures establishing on deeper soil performing better over time than those on shallow soils. The reason for this expectation is two-fold: a) we have imported horse manure compost and used it as a mulch, thereby greatly increasing the resources available for biology to use and b) the combination of fast growing annual cover crops and deep rooted perennial species means that there will be more diversity in space and time working on the soil profile under the tree lines. Changes to soil health should be evident already in 2023's spring samples.