
2023 Soil & Plant Sap Analysis
Moving into our first full growing season we were in a position to fulfill the testing plans set out at the start of the project. For more information, please see both the main Soil & Plant Analysis and 2022 Soil Analysis sections of this website. There you will find details on where, when, how, and why we are testing what we are testing.
The main points to recap are:
- Soil is created by living organisms with energy derived from plants. Without life, soil is dirt: simply geology
- Diverse living plants support a diverse soil microbiome, which in turn provides benefits such as nutrients in exchange for energy, and a level of pest and disease protection; therefore our project focuses on having multiple plant families for a wide range of diversity growing as much as possible
- Our goal is to add the least amount of nutrients possible to the soil proper, e.g. not incorporating organic fertilizers into the mineral soil. If plants and the soil communities are capable of changing the soil, our laboratory tests should detect information about their activity and not about soluble nutrients we have added (or pH altering inputs). The only exception to this has been the one-time application of compost, which is discussed elsewhere
- We use plant sap analysis and observation to guide formulations of foliar fertilizers to remove obstacles to maximizing photosynthesis in our plant communities, which themselves have been arranged to capture as much sunlight as possible through plant growth habits
- We also use seed treatments which bring some fertility, but in amounts so little that they will not be detectable in the soil samples
- Our project is an applied project, not a field trial with replicated controls: we are implementing a system that we hope will work not only to restore the soil, but as it does so, produces viable crops in the process; therefore we are about a holistic approach and not about identifying causation between management and outcomes
- Our project uses techniques and analyses available to everyone and tries to convey the information in a way that most can understand
- Lastly, our project is generating what is called "preliminary data." Preliminary data is information which has enough rigor to be interesting for further investigation; perhaps either at the site or a new research project could be started that incorporates the methods along with the protocols necessary to establish causation
With that background, this page can dive into the trends which we identify as being important.
On this page we will cover:
- the basics of the management zones,
- give context based on the weather in 2023,
- look at trends from the Eurofins & Uoma Vulgaris (Soil Food Web) soil tests,
- describe the soil profiles dug at the end of the drought in late June, early July,
- discuss the initial results from our sap analysis,
- and finish with a conclusion

From Baseline to Management Zones
In 2022, we were able to assess two areas with discretely different soil types. These would serve as an initial baseline for our project. The Sand-Loam (Sample #1) and Clay-Loam (Sample #2) baselines differentiate into:
- Sand-Loam (Sample #1):
- Sand-Loam Tree Line
- Clay-Loam. (Sample #2):
- Clay-Loam Tree Line
- Clay-Loam Alley
- Clay-Loam Margins
To recap the methods:
Each management zone has samples collected and analyzed according to 1) Conventional Soil Analysis with Nutrient Reserves; 2) Near Infrared Soil Analysis; and 3) the Soil Food Web analysis method. On farm analysis is also conducted in each zone while plant sap analysis samples are pulled from plants in each zone as well.
Each zone is intended to be tested with the three kinds of analyses on three occasions per year; the point being to capture a snapshot of the soil's nutrient and biological profile at the various seasonal stages, which should over time begin to offer insights.
The chart below will be useful for the rest of the page, e.g. when I refer to the "spring" you can see that this would be the samples collected on May 20th, from the following locations, and what tests were performed on those tests.
Soil Testing 2023 |
|||
Season |
Month |
Date: Sample Name [Location] (2022 Baseline Sample Reference) |
Tests Performed |
| Spring | May | 20.05.2023: Sand-Loam Tree Line [T2] (1); Clay-Loam Tree Line [T4] (2); Clay-Loam Alley [A4] (2); Clay-Loam Margin [M1] (2) | Eurofins Conventional w/ Micronutrients and Reserves + NIR & Uoma Vulgaris Soil Food Web |
| June | |||
| Summer | July | 30.06 + 05.07.2023: Sand-Loam Tree Line [T2] (1); Clay-Loam Tree Line [T4] (2); Clay-Loam Alley [A4] (2); Clay-Loam Margin [M1] (2) | On-Farm Soil Profiles |
| August | 29.08.2023: Sand-Loam Tree Line [T2] (1); Clay-Loam Tree Line [T4] (2); Clay-Loam Alley [A4] (2); Clay-Loam Margin [M1] (2) | Eurofins Conventional w/ Micronutrients and Reserves + NIR & Uoma Vulgaris Soil Food Web | |
| Fall | September | ||
| October | 26.10.2023:Sand-Loam Tree Line [T2] (1); Clay-Loam Tree Line [T4] (2); Clay-Loam Alley [A4] (2); Clay-Loam Margin [M1] (2) | Eurofins Conventional w/ Micronutrients and Reserves + NIR & Uoma Vulgaris Soil Food Web | |
| November |

March to October 2023 Weather & Event Chart; FMI Data
2023 Weather Effects on the Site- Context
Given that without actively growing plants, and healthy ones at that, soil is not formed, the weather in any given year can greatly impact how the soil develops. Annual cropping systems are more at risk than perennial ones, but a drought which lasts long enough will damage most ecosystems.
In 2023, our site experienced another drought in late winter and early spring. Our site does not have a weather station and the closest official Finnish Meteorological Institute (FMI) stations are far enough away that in the event of scattered thunderstorms those observations may not accurately reflect local conditions. Our closest official proxy in Tapiola, Espoo is 16 km east of our site; the next closest is in Nuuksio, Espoo: 20 km north. There are two closer private weather stations whose data can be found from, for example Wunderground: these are between 3 and 4 km from the site. Those are much better for precipitation information, but even then a matter of hundreds of meters can really make the difference in a drought year followed by highly localized thunderstorms.
This is to say that the data from Tapiola shows a distinct dry period between April 1st and July 1st. During this 90 day period, the observation station recorded a total of 39,3 mm of precipitation, of which 60% fell in a 10 day period between 24.04 and 03.05. Climatic limitations come into play here as well: our growing season usually begins in May and lasts through mid-late September. Being so dry in May and June means that about 2/5ths of the whole growing season were lost, with negative effects lasting into the rest of the year as well once rain returned.
Such conditions would be challenging enough, but combine the lack of rain and a rather cold start to May with the actions we needed to undertake to shift the field into our new system and we had a very rough time of it. Two main points:
1) We are not using herbicide or other pesticides in our project, so to transition away from the strongly established perennial couch grass, we only had tillage as an option. Breaking the soil rather deeply with the Vibroflex and then following through with a harrow meant that we were exposing the soil to the elements, oxidizing carbon, and generally wrecking the soil ecosystem. That would be in a good year. Do that during a drought and your soil dries out considerably, which was why our cover crops didn't begin to establish themselves until very late in the year. Many didn't perform at all or appear to grow more than a single set of leaves before flowering. The only plant that could reasonably recover from this set of conditions were the rhizomatous grasses we wanted to set back: so 2023 was not a successful year in the alleys or margins. Yes, some of the species grew "well"- such as flax- but when you consider how many other species should have been working in the soil it was a failure.
2) We ordered bare root plants to begin our tree lines. They arrived on time and ready to plant in late April. The soil, with its high loam and clay content had plenty of moisture from the snow melt. However, the trees would need supplemental irrigation rather soon given their small root systems and inevitable transplant shock. Due to the complexity of the project, it took time to have the irrigation system delivered, set up, and running: the first time it was used was at the very end of June. Right when the rain came. The trees were kept alive only by the grace of gravity feeding less than a liter of water to them at a time from a cubic meter IBC tank at the top of the hill. The garlic, on the other hand, took advantage of the sun and soil moisture in early May, but was suffering hard by late May and early June. Smaller plants produce less root exudates and don't help things along. Neither does the fact that the rhizomatous grasses also live inside the tree lines at this early stage of our particular project and were able to recover sooner than their neighbors in the alleys and margins due to the beneficial effects of the compost mulch. Which, in turn, meant that the cover crops sown into the east side of our tree lines failed to germinate (the compost was bone dry) and provide any competition to the grass while starting to improve soil conditions. Hence the use of silage tarps starting in June.
The period from July 1st through mid-September was remarkably different. Not only did precipitation return, but the daily low temperatures consistently remained warmer than 10 degrees Celsius, which is a good baseline for encouraging plant growth. Rather predictably, conditions fell off rapidly in October as our weather patterns shift to persistent low clouds and solar radiation diminishes significantly by mid-October. At this point what we are looking for are low temperatures above freezing to allow root growth in annuals and garlic to persist for about a month before deeper freezing events move us into winter.
2023 Eurofins & Uoma Vulgaris Laboratory Soil Analysis Trends
In this section you will find a discussion of the results from the conventional, NIR, and Soil Food Web (SFW) analyses. For more in-depth discussion of each of these, please return to the main page on Soil & Plant Analysis and 2022's Soil Analyses for details on the baselines.
Overall, the most important parameters did not change significantly when comparing the baseline to the final analysis in autumn 2023. Without strong growth of the cover crops we should not expect to see any changes either.
Soil Organic Matter (SOM)
Soil organic matter declined in spring in both the alley and margin samples by 1,4 and 2 percentage points, respectively. This would correlate with the tillage and exposure to sunlight, air, and bacteria; however, we cannot prove that this was the cause. Although both samples from the tree lines also declined, the changes there were marginal in comparison to the drop seen in the others. By autumn, SOM levels across all samples were virtually identical to the starting point in 2022. Is this recovery due to the impact of the cover crops and grasses?
Cation Exchange Capacity (CEC)
Cation exchange was also fairly steady, with only the Sand-Loam Tree Line sample declining significantly, which I will discuss later.
General Improvements
What generally improved was remarkably consistent across all four samples by the end of the season: available and total reserve phosphorus increased between 1,13 - 2,83 X and 1,06 - 1,15 X respectively over baseline figures. There was some disagreement with the Sand-Loam Tree Line samples in this regard, with the conventional testing increasing available P by 2,83 X while the NIR sample returned reductions in both available P and total reserve P by marginal amounts.
Sulfur also increased in all samples: 1,44 - 2,28 X between 2022 and autumn 2023.
Microbial biomass, as measured by both the NIR test and the Soil Food Web method, saw increases in all samples: between 1,26 and 2,35 X. What was remarkable in this is that the change expressed this way was very similar between the NIR and SFW method, despite one being an estimate based on nitrogen and carbon while the other is an estimate based on direct observation.
Both tree line samples saw the greatest increase in decomposer fungal populations, much greater than either the alley sample or the margin (which decreased). Both the Sand-Loam and Clay-Loam Tree Lines (T2 and T4 respectively) saw their decomposer fungi numbers rise ± 5,75 X over the course of the season. The Clay-Loam Margins and Alleys also generally saw improvements in fungal observations, but not nearly as many as in the tree lines. Most likely the reason for the greater improvement in the tree lines was due to the compost acting as food for fungi (Timeline 17.07.2023).
*The numbers from the SFW need to be taken with some caution as the numbers of observations of the organisms was very low, except for bacteria, whose numbers have expanded greatly across all soil samples. In preparing the slides, the technician had to dilute the samples to improve their usability, which is recorded in the notes on each analysis.
Sand-Loam Tree Line (T2) Exception
The sand-loam section of T2 suffered the worst from the drought. Despite beginning with some better benchmark nutrient levels than the clay-loam baseline from 2022, the high sand content and shallow soil probably played a part in how much the area was affected by the drought. Evidence of this poor soil performance was given when, rather early on, many of the garlic plants simply died in the spring.
Available calcium dropped from 630 mg/l in August 2022 to 330 mg/l in May 2023. That number slid even further to 170 mg/l in 2023's summer sample and recovered to 310 mg/l by the autumn. While calcium levels dropped in the summer across all the samples, only the Sand-Loam samples from T2 failed to return to 2022's baseline.
In addition, this sampling area dropped from a CEC of 10 cmol/kg in 2022 to just 6 cmol/kg in autumn 2023. When it came to micronutrients such as copper and zinc, the soil levels also dropped over the course of the summer: copper steadily dropped from 2,6 mg/l to 2 mg/l while zinc fared much worse. Total available zinc readings went from 1,6 mg/l to 1 mg/l: 0,6 X the starting point.
The improvements in total microbial biomass from the NIR and SFW analysis was only 1,26 and 1,27 X over baseline, compared with T4's Clay-Loam changes of 2,19 and 2,35 X.
Overall, I think this shows well why we were right in deciding to include the Sand-Loam areas of the site, at least under the tree lines, in our sampling.
Did anything get worse?
Yes, some measurements declined over the course of the year. What is most striking is perhaps the NIR "soil crumb structure" number: both the alleys and the margins saw massive reductions in this rating. The Clay-Loam Alley dropped from a baseline of 3,1 (6-8 is recommended, 9+ being rated as "very good") to 0,3: the spring figure is a paltry 10% of the original figure. The crumb structure improves again by autumn. In the Clay-Loam Margin, this reading drops from 3,1 to 0,6 (they have the same baseline), but only recovers to a rating of 1 by autumn. This is likely due to the more effective tillage in the margins versus the alleys, discussed a bit below in the 2023 Soil Profile for Clay-Loam Margin.
Magnesium and manganese levels also diminished across all the samples during the year. Like the other key nutrients discussed above, the greatest losses were in the Sand-Loam Tree Line (T2) samples.
Conclusion
It will take years of data collection along with recording the weather, plant growth, and other factors to come to any conclusion as to how our soils are changing. With such high variability in the soils themselves, it will take time to see. Some of what has been discussed here so far is interesting, though, as any consistent change that correlates with management is interesting:
Why did so much phosphorus and sulfur become available?
Was the explosion in soil bacteria the result of management or simply the result of rain- keeping in mind that last year's soil samples were taken at the end of a drought?
Where did the extra calcium come from in two samples, while it was lost in another? It can't be the compost as the Clay-Loam Tree Line (T4) increased by 10% while the Sand-Loam Tree Line (T2) diminished by half: they both received as close to the same amount of compost as is possible with a tractor's front loader and manual raking.
Did the drop in soil organic matter and soil structure recorded in the spring samples from the Alleys and Margins result from the tillage events- will these be one-time dips as our management shifts away from tillage?
We really have more questions than answers.
The section on plant sap analysis, which will be towards the end of this page, will also challenge the reading of these soil tests a bit.
2023 Soil Profiles
I dug soil profiles earlier this year than in 2022. In hindsight, I should have waited until August again. At the time I was unsure if we would dig multiple profiles each year. Ideally, we would, but over time the effect on the tree lines could begin to show with the disturbance to the tree roots. Better to dig once per year and ensure that the digging takes place in as different locations as possible with attention paid to digging the smallest profile possible.
The amount of disturbance to the tree lines will be minimized now that the profiles are being dug in conjunction with the soil testing sites proper, that is, instead of digging a profile in each tree line, there will only be profiles dug in areas of T1 or T2 where sand-loam soils dominate and in T3 or T4 where we find clay-loam.
Despite these not showing changes in a positive sense, they do capture some of the effects of plowing and tillage on soil profiles. For example, we can see in both the Clay-Loam Alley and Clay-Loam Tree Line profiles that the living grass- although we wish to reduce and eliminate it- is holding the soil surface together and forming some kind of aggregation. Elsewhere, in both the Sand-Loam Tree Line and the Clay-Loam Margin Profile, the death of the grass has meant that aggregation formation has ceased and very little else has taken place biologically.
Of course, the idea was to replace the monoculture with a functionally diverse and stratified cover crop in each one of these areas. The drought, as mentioned elsewhere, prevented this replacement and all we can truly see is how tenacious certain perennial grasses can be even in the face of multiple tillage events and drought.
Lastly, the remarks on each soil profile in these sections are derived from field notes.
Note: you will likely want to resize your browser window so that the soil profile pictures are located to the left of the text that accompanies them.

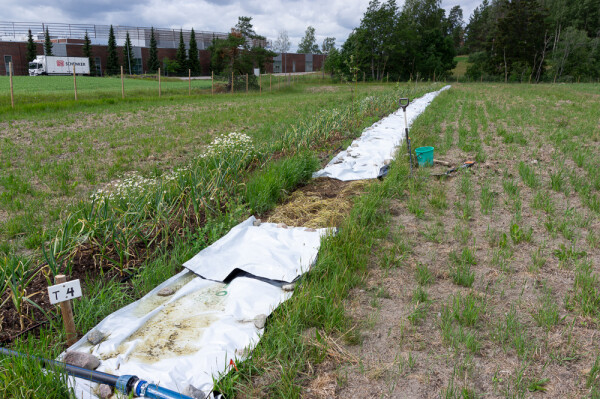
T2: Sand-Loam Tree Line (30.06.2023)
The soil profile dug for T2 last year missed the beginning of the sandy area by about 6 meters, so this is the first profile dug directly into the largest area of sand-loam on site.
Soil Surface
The soil surface is covered with a mulch of composted horse manure. There are very few plants: even the weeds barely grow and the small garlic cloves have failed by this point in the drought.
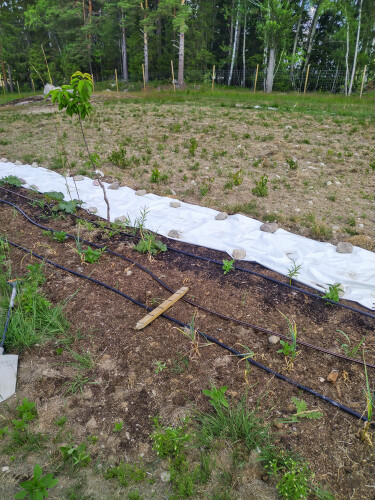
T2 soil surface; notice beyond the silage tarp how many grasses died from the tillage in this patch of sand-loam soil; also inside the tree line the lack of plants, notice the dearth of garlic- most had died by this time. The dark color under the center line is due to the irrigation system working to save the system after drought.
Soil Profile
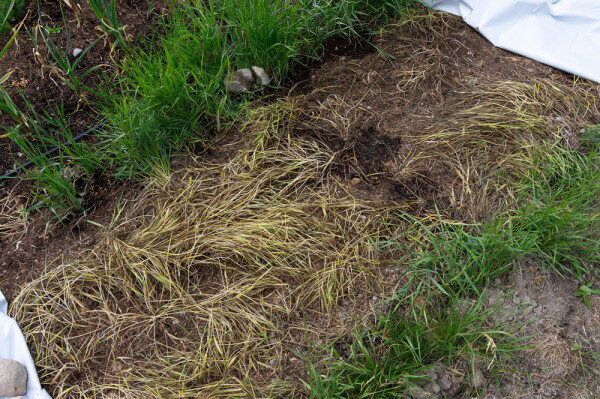
A profile was dug down to 50 cm. The topsoil reaches down 20 cm until there's a very distinct color shift from brown sand-loam to an orange, reddish tinted sand, perhaps from oxidized iron in the soil. There are quite a lot of stones, their size and quantity increase by 30 cm depth, with a very large stone found there. The topsoil has a very fine texture- just like the subsoil- but the dark color until 20 cm corresponds to 1) more soil moisture being held by the soil carbon and 2) the residual effect of the plant roots on soil aggregation. However, you can only see one type of root.
Example of soil texture: almost exclusively sand; very little aggregation due to the fact that the roots are dead- having been tilled in 2022 to prepare the site and the inability of us to establish a cover crop then due to drought and the lack of precipitation to support the garlic in 2023 prior to the irrigation system.
The old root system of the grass is still quite visible, some dead roots are found to the bottom of the profile. Given the porosity of this sandy patch, it is not surprising to find roots down to 30 cm in larger quantities than elsewhere.
However, aggregation is extremely poor to nonexistent. Tillage killed most of the grasses in this patch and without a strong garlic crop we don't even have aggregation in the top 1-5 cm like we find elsewhere.
Compaction is not an issue, though there are many stones. Likewise, the smell is neutral and very little odor to be expected from sand.
I have highlighted one earthworm burrow (teal star) observed in the photograph, but not seen while taking these notes. I did not see any living earthworms or other soil organisms.
The only hint that plowing took place in this profile is the dramatic shift in soil color seen after 20 cm depth, which corresponds with the typical depth found elsewhere.
Overall
Despite having dug the tree holes here earlier it was still surprising to me the quantity and proportion of sand in this section of T2. The profile may be more accurately described as sand with some loam rather than as a sand-loam. However, given the heterogeneity of glacial soils, we will continue to use this phrase as even a few meters away you find true sand-loam. Each soil sample has come back from the NIR test with rather wide range of soil composition.
With precipitation and irrigation, I suspect that this soil could recover quicker than the clay-loams due to the lack of a very serious compaction problem. Fostering diverse living roots, keeping the soil covered, and encouraging the growth of perennials will do good things.

A3: Clay-Loam Alley (05.07.2023)
Note: the following soil profiles were dug a week later than T2 on July 5th, 2023.
Soil Surface
The surface is alternately bare and vegetated. Vegetation is in strips where the Vibroflex and harrow did not kill the couch grass. The recent rain (in the past week) has moistened the surface enough for the cover crop sown at the end of May (over one month ago) to begin to germinate, some of those seedlings are visible. The germination rate is poor and the grass is going to out compete many of the cover crop species.
A3 general view: very much still drought conditions at the start of July.
Compared to the plan, very little biological activity for the first week of July. Still, more growth than in the Sand-Loam Tree Line.
Soil surface: some cover crops can be made out, particularly those of the tillage radish.
Soil Profile
When I look at the soil profile, we can see that the near monoculture of grass has grown densely with rhizomes about 10 cm down from the soil surface. The color of the soil is darker in the top soil until around 20 cm. This is what I had observed in previous soil profiles. The soil is more moist at the bottom of the profile than the soil surface, despite the recent light rain. There is very little evidence of much going on in terms of biology: aggregation is poor and there are no visible soil macrofauna. The soil is very, very dense and it took considerable effort to remove the smearing of the wall of the profile enough to see some original texture.
Despite the density of the soil, roots extend all the way down to the bottom of the soil pit. The roots are fine roots. I don't see any strong taproots from any other species.
Aggregation is restricted to the topmost 5 cm or so; after which the density of roots noticeably declines.
Compaction is evident with the remnants of straw buried by tillage 20 cm down, as in previous profiles here and elsewhere on the farm. The soil does get a little bit looser after you break through the compaction.
The soil doesn't smell anaerobic despite the compaction.
I saw one or two earthworm burrows although I did not see any earthworms.
Overall
No change worth noting from the previous profiles dug in similar soils last year. Subsoiling once we have living roots from a well established cover crop could be a good way to accelerate conditions for regeneration. Without moisture and plants the soil cannot recover.

T4: Clay-Loam Tree Line (05.07.2023)
Soil Surface
Like T2, this is been covered with compost since early August of last year. Unlike T2, this profile is being dug in the east side of the tree line. I am also digging it where we will be turning the tree line into a margin due to the new design. This was the last part of the tree lines to be covered with silage tarps in June, so it has been under occultation for exactly three weeks. This is not long enough to have killed the grass, though much of it is turning yellow now. The compost layer is still intact.
View of the east side of T4 being uncovered for digging a soil profile.
A closer look at the surface, the effect of 3 weeks of occultation on couch grass.
Soil Profile
The soil is a little bit different than the adjacent alley profile. There appears to be a trace more sand here, particularly towards 35-40 cm deep and below. The soil removed from the bottom of the profile is noticeably lighter in texture. Although there is more sand, the soil is still quite blocky. Roots do go all the way down to the bottom of the 50 cm profile and you see a color shift at 20-25 cm deep.
Aggregation is as poor as all of the other profiles: only very small aggregates around the most active root layer, the compost and say 5-10 cm below that mulch.
It is drier because of the silage tarp preventing most infiltration.
I do not see any soil organisms or earthworm burrows.
Plow pan is evident at the usual depth with correspondingly lower root observations below 20 cm.
Smell is neutral, neither earthy nor anaerobic.
Overall
No changes from the previous year.

M1: Clay-Loam Margin (05.07.2023)
Soil Surface
The soil surface is much less populated by plants than the alley profile. This is likely due to the extra harrowing that took place here: to accesss the alleys, one needs to use the margins more and thus the harrow was run here more often. Also, by turning to other alleys, the harrow was run in multiple directions (parallel to the fence, but also in semicircular fashion when turning into another alley), so not only were more passes undertaken but they tilled the soil in multiple directions.
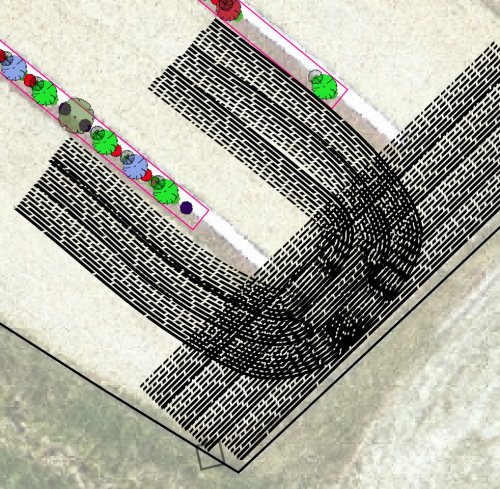
Above: A simple illustration of the multiple passes the headlands received when harrowing the grass clods before planting. Depending on the tools used and the objectives, this passing of the soil in multiple directions may be more useful than a single pass. Future management of grasses in the alleys may be hindered by the fact that it will only be possible to cultivate in a single direction.
Germination of the cover crops is just beginning here as well, like A3, not as thick or strong as one would wish.
View of M1 looking towards T4: notice how much more grass is living in A3 (to right of T4, marked by the blue lay-flat irrigation hose)
M1 soil surface: a lot less grass, germination of cover crops is visible but not strong
Soil Profile
The soil here seemed less compact than the other two that I dug with similar clay-loam soil. Oddly the soil here was coming off in larger chunks even if it was easier to dig. This may be due to the extra harrowing that took place here pulverizing the soil.
The top soil is very similar to the other ones. There are less fine roots from the grass than in other sections, but it follows the same pattern as before in which we have more roots present until you reach 20 cm down where the old plow pan is. After that, the number of roots diminishes.
The main difference is the pulverization from the more successful attempt to kill the grass here than elsewhere. This has resulted in an unclear soil surface, no large numbers of strong living grass roots creating aggregation. It is a good example of what soil disturbance can do.
We can see straw buried underground that has not decomposed at that level (circled in pink).
Soil is blocky, same smell as other profiles.
Likewise with the other samples, no observed earth worms or other soil life.
Overall
No improvements over the previous year. Perhaps the only benefit here is that the grass has been suppressed better than elsewhere.
Plant Sap Analysis 2023
For the 2023 season we had access to plant sap analysis from Nova Crop Control (NCC) in the Netherlands. I requested enough sampling bags to potentially cover the entire growing season, with samples set aside for garlic, couch grass (Elymus repens) in the alleys*, as well as un-specified samples for anomalous or interesting things we saw.
*I knew that our efforts would not kill the grass entirely and this grass, being present across the whole field, would allow us to sample the same species in locations with different conditions (including cover crop diversity)
On the main overview page, I provide a basic example of what plant sap analysis consists of. Also, our project assistant during 2023 wrote a blog, “Regenerative agriculture with plant sap analysis” about the topic and some of the changes in plant sap during this summer (link).
Plant sap covers 22 different measurements: all the major nutrients as well as pH, sugar percentage, electrical conductivity, sodium, nitrogen in four ways- NH4 ammonium*, NO3 nitrates*, N in nitrate form*, and total N, chloride*, silica*, iron*, manganese, zinc, boron*, copper, molybdenum*, and aluminum*. Those nutrients marked with an asterisk are not measured in either the conventional or NIR soil tests.
From the practical side, collecting plant sap analysis at the scale we did for this project proved to be more labor intensive than expected. This was in part fueled by three factors:
1) The drought meant that although we could collect material and send it to the lab, we would not be able to act on the analyses. In our project, sap analysis is primarily used for providing data to help formulate foliar applications. If we were to apply foliar nutrition to the alleys and margins in a drought when the cover crops were not growing- when the only plant growing was the grass we wanted to replace- we would be working at cross interests to project goals
a. An important caveat to this was our testing of the garlic in May and June, which allowed light foliar supplementation to take place in the hopes of tiding the plants over until the drought broke- the drought did not break in time, but we did pay particular attention to the cash crop;
b. Also, when I sprayed the garlic, given the low levels of nutrients being used (mostly compost and seaweed extracts), I applied the same sprays to the trees and rhubarb growing in the tree lines, to assist them through the drought
2) The combined effect of drought and an unwillingness to promote couch grass meant that many planned samples were significantly delayed. When we finally were able to begin collecting sap according to plan in late July, the number of samples we could use increased significantly over the plan
3) The weather shifted in July and became rather wet. Plant leaves must be completely dry or else they will begin to decompose rapidly in route to the laboratory. Plant leaves also must be collected in the morning while their tension is high, so that there is enough sap to extract. This means the leaves are likely to be covered in dew. Some plants are easy to dry, like rhubarb, but others, like grasses, require considerably more effort and time
Despite the practical drawbacks, we found that the sap analyses we received reported very interesting measurements.
Shipping Affects the Management Schedule
How does sending plant sap to the Netherlands work? We used Finland’s national postal service as the price difference between Posti and dedicated couriers was not significant with the volume we are at. Using standard shipping it takes about 7-10 days for a report to be returned digitally by NCC. We receive both a PDF version for each sample as well as an Excel file combining all the samples from that shipment.
In one month you can take, on average, three sap samples. However, during that time, you will only have access to two reports if you wish to wait 5-7 days after making an adjustment to the growth parameters (irrigation, fertigation, foliar application, even pruning or perhaps other physical modifications) before collecting a new sample to measure. This is why many foliar applications are taken on a two-week basis: one week to receive a sap report and one week to wait for effects (on average, depends on the application) before sampling again. If one had more resources, you would also collect samples immediately prior to making an intervention as well, so that you do not assume the intervention- which can take place days or even a week after the first sap sample was taken- is responsible for changes that may have taken place “naturally” while waiting for the analysis to return. Again, please note that our project takes great pains to avoid claiming causation from our interventions as we cannot, in a scientifically robust way, demonstrate that this is the case. Our project is an applied project, not a rigorous field trial.
One additional point about plant sap analysis: NCC provides ranges of optimal nutrition for each crop, however, those ranges do not change according to the plant’s growth stage. As they are based on NCC’s own internal research, we also do not have direct access to “why” the ranges are presented the way they are. Still, when beginning with plant sap analysis, it is useful to use the information provided by the laboratory as your starting point for understanding the nutrient levels. Through experience one may be able to ascertain whether the ranges could be altered according to different conditions and crops.

When and how many?
In the chart on the left, you can see when we collected samples, which species, where they were collected from, how many samples on that date per crop, and explanatory notes. Given the total number of samples we collected and the number of PDF reports we have, we will not be uploading every analysis.
If you wish to have the raw data in an excel format you can contact me with a request.
Interesting Findings
While comparing plant sap results with the soil analysis is fraught with difficulty and nuance, some comparison between the two is useful. The following is simply reporting what the figures were and is not an attempt to describe whether the soil tests are right or wrong.
Of course, keep in mind that the optimal rates provided by NCC have their own issues: for example, they are from a single third party, they do not change during the growth cycle of the plant (optimal P is optimal P regardless of growth stage according to the reports), and whether those optimal ranges are in fact what you would want in your context is a question that only time and experience with sap analysis could provide.
We will refrain from discussing the rhubarb samples here as they do not have recommended values from NCC. In general, we understand the value in collecting data over a number of years before drawing conclusions: thus, this discussion is simply the start of a longer process of gathering data and asking questions along the way.
Following are accounts of phosphorus (P), nitrogen (N), potassium (K), and calcium (Ca). I’ll also look briefly at some of the micronutrients which appeared to be deficient across many samples.

Phosphorus (P)
One of the most interesting things we found is that despite both conventional and NIR soil testing indicating a general lack of available phosphorus, P was rarely deficient in any of the sap samples with suggested levels from NCC. According to our conventional tests, the average available phosphorus measured across 2023 clay-loam samples was just 4,4 mg/l. The NIR sampling suggested we had more available P than the conventional tests, with 5/10 measurements being in the “good” range. Of the other half of the measurements, P was a “little low” 4 times and low once. As mentioned in the 2022 analysis, both laboratory measurements of soil P indicated that total reserves available are quite high (e.g., > 3 000 kg/ha).
So, what did the sap show?
Garlic
In 17 garlic samples, phosphorus was deficient in 8. However, of those 8, only 4 were at least 10% below the threshold of optimal. Garlic P levels were optimal 7 times and excessive twice (both the old and new leaves of the very first sap analysis).
Grasses
In the alley grasses, P was never deficient and in fact it was excessive 15/20 times. (Left: graph showing the P levels in each normal alley sample ["good" and "poor" measurements were only taken twice over this period] in parts per million, optimal range lies between the two black square dotted lines)
In the margin grasses, P was never deficient and was excessive 16/22 times.
Radish
Finally, in the radish samples, P was excessive 6/6 times.
P summary
Of 65 samples from three species with recommended levels from NCC, P was deficient only 12% of the time and excessive 60% of the time. It is worth noting that 75/81 (92,5%) of the sap samples were collected after the drought broke and water was no longer a limiting factor (of course damage had taken place to the system’s overall health). In fact, the only deficiencies in P were recorded during the drought period in garlic alone. Were the grasses and radishes accessing P from the reserve pool? Would the garlic have had enough phosphorus if ample water were available? We cannot say for sure, but it is very interesting that despite rather low P measurements in the soil, the plant sap analysis said P was excessive so often.

Nitrogen (N)
Before diving into nitrogen, it is interesting to note that our sap analysis showed very low levels of nitrates in the plant sap. Nitrates were either always optimal or even deficient in garlic, grass, and radish. In rhubarb, however, nitrate levels were much higher than any other species on 29.08.2023 (coinciding with the large rain event) and those levels remained elevated over prior samples or other species even into September.
Soil tests do not tell us how much nitrogen is available, but the NIR soil test does provide a nitrogen “release capacity.” Like with other nutrients in the NIR test, these figures are labeled as low, a little low, and good. Of the ten clay-loam samples, only once was this figure labeled as “good” and barely reached that threshold when it did (100 kg N/ha release capacity in Clay-Loam Margin Spring 2023). The same tests, however, suggest that the total nitrogen reserve, is, on average, more than 5 000 kilograms per hectare. Now, under no circumstances would anyone wish to have even 10% of that be available. What it does mean, however, is that there is nitrogen in the system which some suggest that, under the right circumstances, could be moved from the inaccessible reserve to the plants through biological mechanisms.
Keep in mind that no nitrogen has been applied to the soil in the alleys and margins since 2018. The only nitrogen provided directly to the system in quantity is from the composted horse manure applied to the tree lines. Later, nitrogen was applied in the form of fish hydrolysate in a mix with compost extract and seaweed extract with the tractor’s sprayer to the alleys and margins on 24.07.2023.
So, what did the sap show for total nitrogen? We could also look at ammonium (NH4) and nitrate (NO3) results, but to keep this manageable and understanding our single season of data, we will just look at the total nitrogen.
Garlic
In 17 garlic samples, total nitrogen was deficient in just 2 samples. Otherwise, it was optimal 12/17 times and excessive 3 times (two of these are the first paired sample from May). Neither of the two deficiencies were > 3% beneath the threshold for optimal garlic sap.
We thought that nitrogen should be available in greater amounts here because of the compost, however, the NIR tests do not indicate any significant difference in the N release capacity between the two tree lines where compost was added and two other sampling locations compost. This is likely in part because the compost was added a mulch and only partially mixed into the soil during management (weeding and harvesting). Therefore, most of the impact of the N in the compost would come from leaching, which could be detected by the NIR soil test as releasable N. But this is not what the soil tests indicate so far.
Despite low release capacity in the soil across the time frame, our garlic had ample or even excessive nitrogen available to it.
Grasses
In the alley samples, total nitrogen was deficient just once. This deficiency was detected in a sample of grass that we labeled as being in “poor” condition; when tested two weeks later this same area of grass returned to optimal levels. Otherwise, alley grasses were optimal 12/20 times and excessive 7 times. Of those excessive nitrogen measurements, 4 were from A1; every grass sample from A1 had more nitrogen than NCC considers optimal. (Right: graph showing the N levels in each normal alley sample ["good" and "poor" measurements were only taken twice over this period] in parts per million, optimal range lies between the two black square dotted lines)
In the margins? Grass was deficient once, optimal 12/22, and excessive 9/22 times. Of those excessive measurements, 4 were samples collected from the area of M1 where the compost had sat prior to being used as mulch. This area consistently had the highest nitrogen levels and always was excessive.
As mentioned above, the alleys and margins were sprayed in late July with 1,5 liters of fish hydrolysate in a foliar mix (150 l water, 1% solution). We recorded from sap samples taken immediately prior and one week later, an average increase in total N of about 200 ppm. We cannot say that this 1% by volume application of fish plus compost and seaweed extracts necessarily caused this result, but an intervention took place and changes were recorded after.
Continued monitoring of the grasses across the site showed that the nitrogen levels remained consistently optimal even weeks to months after application.
Radish
Total N in the 6 radish samples were optimal 5/6 times and excessive once, no deficiencies.
N Conclusion
If we accept NCC’s recommended values, nitrogen was not a limiting factor in any of the crops we tested. This is an unexpected result given the history of fertilization, the differing crop species, and the impression we had from both soil samples and our own observations.

Potassium (K)
Potassium has consistently been a nutrient that both laboratory soil analyses report as being both available and in reserve in ample or excessive quantities across the testing period. In fact, as the samples were collected in summer and autumn 2023, the NIR test suggested that the available potassium would be in excess. This coincides with the increased soil moisture as the season progressed, particularly after the very large storm which dropped ±100 mm of precipitation at the end of August, right around the time of summer soil sampling.
Excess potassium has several negative effects not only on the plants, but also on soil chemistry. In clay soils, it may cause dispersal/poor stability of clay particles in addition creating availability issues of key micronutrients in plants.*
*See, for example, "Effect of applied potassium concentration on clay dispersion, hydraulic conductivity, pore structure and mineralogy of two contrasting Australian soils, link."
If so, this could help account for the lack of soil structure across the site.
Garlic
Garlic displayed a general lack of potassium throughout the growing season, including in the first samples collected in mid-May (12.05.2023) and early June (09.06.2023) when the drought was steadily progressing. The situation with the garlic was deteriorating rapidly by early June, which can severely limit the availability of potassium to plants. This could have been picked up on by the sap analysis with a reversal in the relative concentration of potassium in the samples: the May young garlic leaves had higher than the old, whereas by June this had reversed.
Overall, potassium was rated deficient 14/17 times and only optimal three. Never excessive in garlic. On average the old leaves had 1,21 times as much potassium as the new leaves. When examining the difference from the lowest threshold for optimal, garlic old leaves were on average only 99% of the lowest optimal, while the new leaf average was 18% below that same number.
Grasses
The grasses began to be tested after the drought broke, which can help explain the difference between the garlic and grass.
In the alleys, the grass measured: excessive 13/20, optimal 6/20, deficient 1/20. These results closely align with the suggestion from the NIR tests that we would have excessive available potassium, as opposed to the conventional soil test which reported satisfactory or good levels. (Left: graph showing the K levels in each normal alley sample ["good" and "poor" measurements were only taken twice over this period] in parts per million, optimal range lies between the two black square dotted lines)
In the margins: excessive 15/22, optimal 5/22, deficient 2/22. Similarly to nitrogen, we see elevated levels of potassium in grasses from M1 where the compost sat. In the M1 compost patch sample, at the end of July (coinciding with 7 days after the spray mentioned earlier), potassium levels rose to more than ten thousand parts per million, fully 1,5 times the high range of optimal. By late August and September, these numbers and dropped some but were still wildly excessive (> 6650 ppm).
Radish
Potassium was measured as excessive in all six samples, with the older leaves containing more potassium than the new ones.
K Conclusion
A lack of potassium does not appear to be a limiting factor in production at this site, from soil and sap perspectives. In fact, the opposite appears to be the case. The soil’s cation exchange capacity is imbalanced towards potassium (and magnesium [Mg]) with a limited calcium component. Will it even be possible to remediate excess potassium without altering the soil’s chemistry through the application of limestone? Only time will tell if a focus on plant community diversity and removing roadblocks to plant health through foliar applications will alter the soil’s chemistry to any significant degree.

Calcium (Ca)
The soil reports regarding calcium are very similar to those about phosphorus: our soil is reported as deficient or low, sometimes with NIR readings as low as only 10 kg of calcium per hectare. With no additional calcium being added to the soil in the near term, except which came with the horse manure compost, the expectation would be to have very low calcium readings.
Garlic
Calcium in the garlic leaves changed dramatically between the May, June, and July samples. In May, both the old and new leaves were very deficient: the young leaves in May had only 17% of the lowest optimal calcium parts per million suggested by NCC. The older leaves were better, but only by comparison, about 51% of the lowest optimal. These levels began to improve by June’s sampling, with the young leaves still strongly deficient at 28% of the lowest optimum, but the older leaves had improved to just within the optimal range. By the time we harvested, the situation reversed: the young leaves began to, except on one of six sets of paired garlic samples, have more calcium than the old leaves. In each case, the levels were well within the optimal range and one pair of garlic leaves (from T4’s 10-20 meter section) the calcium levels were in excess.
In total, calcium was measured as: excessive 2/17, optimal 12/17, and deficient 3/17.
Grasses
In the alleys, calcium was measured as: excessive 5/20, optimal 10/20, and deficient 5/20. Of those deficiencies, two samples were less than 90% of the lowest optimal. (Right: graph showing the Ca levels in each normal alley sample ["good" and "poor" measurements were only taken twice over this period] in parts per million, optimal range lies between the two black square dotted lines)
In the margins, calcium was measured as: excessive 4/22, optimal 11/22, and deficient 7/22. Interestingly, the excessive calcium measurements always came from the species of grass growing along the fence in the M4 collection area (which also included couch grass and another species growing adjacent to the tree line).
Radish
Radishes displayed very low levels of calcium: all 6 samples were deficient. If one needed a strong indication that excessive potassium can influence the uptake of other nutrients such as calcium, this would be a good one to look at. However, the excess of potassium did not seem to impact the boron (which were optimal- the only deficiency was less than 1% of optimal) or manganese (which was almost universally excessive) levels. The average calcium level was only 38% of the lowest optimal range.
Ca Conclusion
This is an interesting conundrum. The calcium levels are, by most laboratory measures, low in our soil. Even the reserves are considered low. Yet, only the radishes were consistently deficient. Otherwise, the grasses across the site generally had sufficient or even excessive amounts of calcium in their sap. And with the garlic, we saw that by the end of their growing season, levels had reached optimal levels or been driven to excess on one occasion.
In the case of our garlic, the plants received some calcium through foliar applications which included whole cow’s milk on three occasions: 150 ml on 23.05, 100 ml on 06.06, and 200 ml on 14.06; or 1,25%, 0,8%, and 1,6% of the 12-liter mix, respectively. Whether the calcium in the whole milk, compost extract, seaweed extract, or fish hydrolysate could account for the increases in calcium measured once again, more than one month later, in July is questionable.
In the case of the grasses, we did see an increase in calcium that coincided with the application of the fish, seaweed, and compost foliar. Fish hydrolysate is made from whole fish, bones and their calcium included. But given the limited mobility of calcium within plants, would this account for the sufficient levels of calcium seen throughout the rest of the season, with measurements being taken many weeks to months later?
As the project heads into spring 2024 and we begin to collect plant sap analysis again, we will continue to monitor all the plant nutrients closely. Calcium is going to be high on our list to detect deficiencies for and attempt to help through foliar applications, despite their limited function. Our goal will be to continue assisting the plants in the creation of healthy soil which can begin to move nutrients from the reserves. Will this be enough in the face of competitive ions such as potassium being in such excess? Again, only time will tell. However, as stated elsewhere, if we apply lime to the soil to increase pH and provide additional calcium, we will not be able to test if the plants could have managed it together with our assistance from above. Unless, of course, we wait 7+ years for the effect of the limestone to diminish and "start over."

Plant Sap Analysis: Micronutrients
One reason we want to use sap analysis is to see levels of nutrients which are not reported on our soil tests, such as molybdenum (Mo), boron (B), and iron (Fe). Nearly all nutrients play important roles in the plants’ overall health. Despite not being needed in large amounts, when plants are deficient in these three nutrients, their capacity to photosynthesize is decreased. Iron is perhaps one of the oddest of the micronutrients in that its presence in the soil can almost be taken for granted as the most abundant element in earth’s crust, but iron is often deficient in many plants.
The results of our plant sap analysis indicate that, across garlic, grasses, and radish, molybdenum was either deficient or barely optimal. We also found that boron was a limiting factor at different times for different species, with levels dropping in the summer-early autumn samples across the board. (Left: graph showing the Mo levels in each normal alley sample ["good" and "poor" measurements were only taken twice over this period] in parts per million, optimal range lies between the two black square dotted lines)
Finally, iron was not even vaguely uniform in its uptake across the species. It was found in ample amounts early in the garlic, but levels began to decrease later in the season. With radish, iron levels increased as the plants aged from deficient to optimal and excessive amounts. In the grass samples, iron was more likely to be optimal than the other species. Still, it is one to keep a close eye on and have available for formulating into foliar applications as it plays such a critical role in the plant’s growth.
Other micronutrients, such as copper (Cu), zinc (Zn), and even silica (Si) all have a role to play. But with more than 80 samples and 22 parameters each, the “complete” look at sap analysis would take a lot more time and effort than it is worth at this stage. We can only look at the basics for now. In 3 years, when we have 4 years of sap analysis, we can start to get serious about trends and statistics.
Sap Conclusion: Where to go from here?
The most important thing heading into 2024 is to ensure we have trace minerals on hand to keep up with the sap sampling schedule.
What we cannot do is determine which nutrients will be applied in advance for much of the site, apart from molybdenum. However, we can promote early growth in the plants before drawing samples- intervening in the critical weeks after emergence- using biostimulants like compost and seaweed extracts, mixed with even smaller amounts of molybdenum than usual.
Applied at sub-fertilization levels, seaweed and compost extracts rely on the plants’ ability to respond to compounds other than nutrients, ideally promoting better root and shoot development. Given how rapidly many annual plants develop in the first 3-4 weeks it does not make too much sense to adjust a foliar application to a seedling’s sap levels.
The only crop I am willing to preformulate foliar applications for beyond a biostimulant is garlic. Potassium, calcium, magnesium, boron, copper, and molybdenum are all nutrients we need to consider adding as soon as possible to the plants, likely in late April. The key on a preformulated application is to keep the levels just low to induce a response, but expect large gains. By waiting until mid-May once again, the garlic plants will have enough leaves to begin sampling.