
2022 Soil Analysis
This page is a vital step in understanding our project. Here I will discuss the state of the soil as we saw it in 2022 and how our view of the soil is different than conventional thinking. In other words, 2022's benchmarks are interpreted, in part, through the agroecological paradigm we are using to guide goals and management. The interesting part of a soil test is not really the numbers, but what we think they mean. Over time, as additional years of data become available, we can then compare the changes, season by season, to these benchmarks.
For optimal viewing, please resize your window until the images of the soil profiles move to the left hand side of your screen
Establishing a Baseline
In 2022 we had enough funding to conduct laboratory soil sampling from two of the four management zones. Two zones were deemed sufficient because the changes in management had not rendered any changes to the site yet. This was due to the drought which prevented the cover crops from growing. Budgetary constraints also ruled out the possibility for a full run of tests.
Soil to be combined for laboratory analysis were collected from the shallow soil area (outlined in red) and from the deeper soil areas (outlined in blue). For all of the laboratory tests, the shallow area is Sample #1 and the deeper area is Sample #2.
On farm tests were conducted along the axis indicated by the black line running along the tree lines, about 30 meters in from the start of each. Note, of course, that these are overlays on top of the site plan: the field has not been planted yet at this point in time, but the design features are left in the diagram for orientation.
Compare the locations of 2022's soil tests with the desired soil sampling program and it is clear that, due to the site's relative homogeneity, that each of the Samples and the profiles can provide baseline information about each of the four management zones. In the future, each management zone will be able to draw baseline laboratory information from one of two root data sets:
- Sample #1
- Corresponds to Tree Lines 2/2: Shallow Soil Polyculture
- Can be held as a reserve in case we are able to also analyze soil from the dry margin areas
- Sample #2
- Corresponds to Tree Lines 1/2: Deeper Soil Polyculture
- Corresponds to Alleys 1/1: Deeper Soil Annuals
- Corresponds to Margins 1/1: Deeper Soil Polyculture
The last item of note is that the tests were spread out over a wider range of time than we would have liked. However, one must consider that the project was just beginning and it was necessary to schedule actual site work alongside arranging with the laboratories and technicians to come take some of the tests. Hence, 2022's information does not provide the absolute best baseline to work with. Over time, however, once we have multiple years of data, we will see that it serves its function.
2022 On Farm Testing
Soil profiles were dug on 03.08.2022 in four locations as indicated in the graphic above: one for each initially proposed tree line. Tree Line 5 had not been created during 2022. The reason I dug a profile for each tree line was that we would not necessarily be able to dig again in the future without compromising tree health. This way I could also have a string of profiles across the changing slope to reference. The first soil profile will have slightly more information and I usually use it as the benchmark for comparisons.
The profiles were dug in the middle of the drought- more than a month without effective rainfall. Air temperatures were warm and if it were not for the lack of rainfall, this would be the height of the growing season. Growth has begun to stop across most of the site. This means that aggregation would begin to suffer as these structures are built and maintained from energy delivered by plants. In addition to on ground observation, European satellite imagery (Sentinel 2) clearly indicates this in comparison to other areas of the farm.
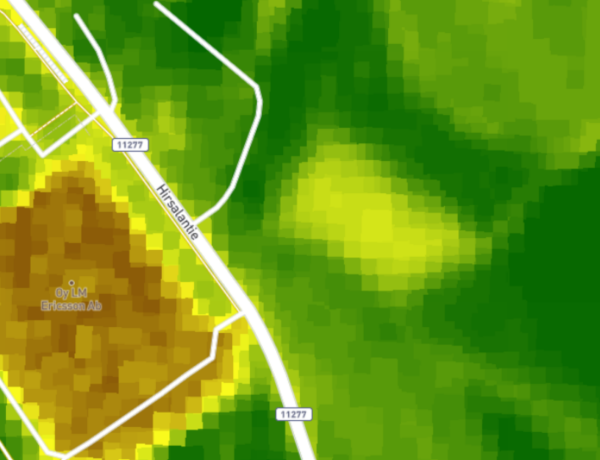
Sentinel 2 NDVI 02.08.2022. Site is clearly visible as a yellow rectangle representing poor growth. Image obtained from TerraScope by Vita Remote Sensing
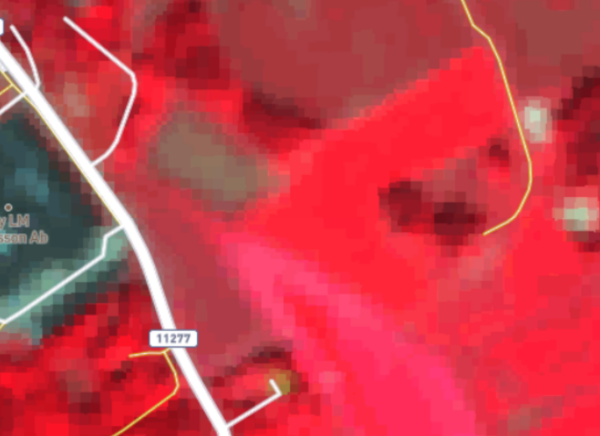
Sentinel 2 Color Infrared Image 02.08.2022. Site is clearly visible as a grey rectangle; red indicates vegetation. Contrast to the bright pink and deep reds of cover crops adjacent. LillNAP's vegetation is more comparable to the factory across the street. Image obtained from TerraScope by Vita Remote Sensing
Utilizing a rewetting procedure, in which you disregard the first round of water infiltration when soils are very dry, the infiltration rates across the samples were all less than 60 seconds for 1/2 liter of water simulating a 25mm precipitation event (1 American inch). These are good infiltration rates and are expected when testing even a monoculture perennial cover. I did not attempt to find the saturation point in 2022.
Soil profile photographs have been annotated to help go with the text. There are three things to note about the photos.
First, there was a delay between the digging of the profiles and the photographing of them by 9 days due to an issue with my camera. I took photographs with my cell phone during the dig, but they are not as useful for checking fine details, though they make clear that the notes taken on observation day regarding soil color are correct.
Second, I do not have a lens which can remove distortion completely, especially at the focal lengths necessary to take these pictures in a small pit which is about 50cm in each direction. Taken at 26mm with an APS-C sensor and at such short range, the photographs clearly cause issues. The most obvious problem is that the measuring stake often appears to be sticking above the soil surface. Getting the exact same vantage point is also not so straightforward.
Third, when digging in soils with a moderate clay component (±30%), it is difficult not to "smear" the sides of the test pit. After digging to the desired depth, I have used both the shovel and a knife to break off the worst smeared parts possible, revealing a more natural soil face. But this takes time and to painstakingly remove all the faces smoothed by the shovel is unnecessary for what we are doing. So some of the photographs will appear to have more or less texture than others
Please keep in mind the discussion on the main Soil & Plant Analysis Page regarding the on farm tests being used for context.

T1: Shallow Soil High in the Landscape
Soil Surface
The surface is covered in a thin thatch from this year and previous seasons. If a proper carbon cycle was in place, last year's grass should have been decomposed by this point. One potential reason for the lack of decomposition could be that the monoculture of grass means the carbon and nitrogen ratio of the residue is tilted way towards high carbon. Without the proteins from the nitrogen component, it's more difficult for the soil to decompose the organic matter. There's also the fact that the mulch is not actually in contact with the soil surface: the clippings are held up by the many crowns and dry stems from previous cuttings and this reduces decomposition greatly as well.
Soil Profile
Grass roots and some small tunnels and burrows extend to the bottom of the soil profile (50cm). The density of root growth is, as expected, highest at the surface and diminishes as you look further down into the soil. The most dense root systems are found in the top 20 cm. The most active topsoil (1) is very clearly forming where the grass rhizomes and the residue from mowing has been deposited; this layer is approximately 10 cm deep. From there, the soil is less populated by roots but still strongly down to 20 cm (2). After that the root density diminishes rapidly. Root type is uniform due to the monoculture.
Since roots build aggregates, the number and size correspond as expected with root density. The finest aggregates are right under the soil surface where the most dense root systems are. Aggregation is evident until around 20cm deep. As you move from the surface downwards, the aggregates grow in size and reduce in number until the area indicated in orange (3) which is a transition zone.
The soil is very compact. As expected the soil is very rocky with also a large sand component in addition to the clay. Only the top five centimeters or so are easily cut by a knife: below the most active root zone the soil seems relatively uniformly compact, until the compaction becomes most evident below 20-25cm. It is there that you begin reaching the subsoil (4). Aggregates almost disappear here and the soil no longer has the oxidized coloration. Despite the compaction, the soil smells earthy, although not very much so. The positive side to that is that it does not smell foul even at 50cm below the surface, meaning we do not have large anaerobic zones.
I did not observe any earthworms, there are a few soil born insects but not very many. Burrows are not evident in the photograph, but were seen while making observations. So the lack of living earthworms in the soil can also be due to the time of year the profile was dug and not simply because of low populations.
The lack of good rooting below 20cm corresponds with the visually evident residue from plowing: the stubble from crops grown years ago (2018 at the latest) have still not broken down and show where they were turned in (pink is a compaction zone, circles are residue).
Overall
This profile shows that the soil is benefitting from perennial cover. The lack of diversity, however, means that we only have a few root types and nearly all of the roots are of the same species. Rooting depth is moderate at 20cm. Since there is evidence of earthworm and other soil life (insects) being present, my estimation is that if we can improve the ecosystem processes that the soil will recover relatively quickly due to the 20cm deep topsoil.

T2: Deeper Soil in the Upper-mid Slope
Soil Surface
The surface notes are generally the same as T1 with one major difference: the grass was a darker green here because of the deeper soils. See the notes on the effect of shallow soil shedding water to adjacent areas in the Site Analysis documentation.
Soil Profile
Grass roots and some small tunnels and burrows (blue star outlines one such) extend to the bottom of the soil profile (50cm). The density of root growth reduces more rapidly than T1. The most dense root systems are found in the top 10 cm (1). Until the plow pan between areas 2-3 (pink), roots are evident but not abundant. Root type is uniform due to the monoculture.
The finest aggregates are right under the soil surface where the most dense root systems are. Aggregation under this layer is less evident than T1. Overall aggregation poor.
Strangely, my notes indicate that the soil is less compact than T1 and was noticeably easier to dig. The first 30 cm of soil is much less rocky, but the texture is more blocky: the soil came out in much larger chunks. My notes indicate that it appeared that the soil has a higher clay content and this was confirmed by NIR testing later. The transition zone between top and subsoil appeared to be less obvious, although its location is relatively easy to determine due to the root density shift and presence of residues from plowing is. The color shift was less dramatic than in T1 yet occurs in much the same place, around 25cm down. It is also here when larger rocks begin to be found while digging, which makes sense given that we are only about 14 meters away from the previous tree line which is perched right above shallow soil.
Despite the compaction, the soil smells earthy, although not very much so. The positive side to that is that it does not smell foul even at 50cm below the surface, meaning we do not have large anaerobic zones.
I did not observe any living, there are a few soil born insects but not very many. Burrows are evident in the photograph (blue star).
Overall
This profile shows that the soil is benefitting from perennial cover, but not as clearly as T1. That the soil seemed easier to work and less compact, despite having more clay, and yet finding that the root systems were relatively less developed here was puzzling. Strong rooting depth is poorer at ±10-15cm. Like with T1, this soil is not healthy, but the perennial root system of the grass has begun to stabilize matters.

T3: Deeper Soil in the mid Slope
Soil Surface
The surface notes are generally the same as T1.
Soil Profile
Grass roots and some small tunnels and burrows (blue star outlines one such) extend to the bottom of the soil profile (50cm). Root growth reduction as you go deeper into the soil is between T1 and T2's profile: we don't have nearly as many roots as the first example, but more so than the second. The most dense root systems are found in the top 5-10 cm (1). In the photograph there is no residue from the plowing which is why the pink lines are dashed. Root type is uniform due to the monoculture. I have written that the soil here is perceptibly more moist than the first two profiles, which should be expected as the total amount of water moving through lower parts of landscape is greater than the top of slopes.
The finest aggregates are right under the soil surface where the most dense root systems are. Aggregation under this layer is less evident than T1. Overall aggregation poor, but slightly better than T2. Due to poor aggregation the transition between top and subsoil is less evident (3).
My notes indicate that the soil here was the most compact of the four. Although there is a large stone evident at the bottom of the photograph, the rest of the profile seemed largely devoid of stones. This should be expected since we are into the truly deeper soil. There was a color shift around 20cm down where the clay begins to take on a green-blue color. This shift is noticeably absent from the photograph used for annotation, but is present in my notes as well as the cell phone photograph I have of the profile on the same day.
Despite the compaction, the soil smells earthy, although not very much so. The positive side to that is that it does not smell foul even at 50cm below the surface, meaning we do not have large anaerobic zones.
I did not observe any earthworms, there are a few soil born insects but not very many. Burrows are evident in the photograph (blue star).
Overall
This profile shows that the soil is benefitting from perennial cover, not as clearly as T1, but more strongly than T2. Again, like T1, the beginning of aggregation in the top 20cm of soil indicates that with increased diversity and management intended to improve rooting depth we should see benefits quickly since we at least do have aggregates and soil life to foster.

T4: Deeper Soil in the Low-mid Slope
Soil Surface
The surface notes are generally the same as T1. There is a difference, however, in that some white and red clover (Trifolium spp) were observed growing in the area, increasing diversity slightly but also bringing about functional diversity.
Soil Profile
Grass and clover roots along with some small tunnels and burrows extend to the bottom of the soil profile (50cm). Paradoxically, the notes I have for this profile indicate that there were fair numbers of roots down into the top 15-20cm even though the photograph looks the worst of all four. In the photograph there is some residue from the plowing (pink dashed circle). It is not very clear in even the full resolution photographs (from both the cell phone and DSLR), but my notes indicate that during direct observation of the soil I was able to clearly discern both clover and grass roots. I even found some nodulated roots and split those open revealing pink centers, so nitrogen was being actively fixed there. This does not, however, indicate that we have a strong root system or lots of nitrogen being cycled. I have written that the soil here is, as expected, the most moist of all the samples.
The finest aggregates are right under the soil surface where the most dense root systems are (1). Aggregation under this layer is quite poor.
My notes indicate that the soil here was the easiest to work of all four with the soil coming off in large chunks. There were very few stones and no large rocks. This should be expected since we are furthest away from the shallow bedrock. A color shift at 30cm down is similar to T3: the wet soil, which at the time of digging was observed to be more blue than green, rapidly oxidizing during the days between the dig and the photograph used for annotation.
Despite the compaction, the soil smells earthy, although not very much so. The positive side to that is that it does not smell foul even at 50cm below the surface, meaning we do not have large anaerobic zones.
I did not observe any earthworms, there are a few soil born insects but not very many. Burrows are not evident in the photograph.
Overall
This profile was interesting to dig because the difference between the photograph and the notes are quite dramatic. This is one reason why we rely upon notes taken at the time of digging. I should I have used my phone to take pictures of the profiles when they were dug rather than wait for the camera, however, because as with T3, the effect of oxygen is quite present in the subsoil. Having noticed that this spot had clover and deciding to dig revealed some differences in rooting density and aggregation. Another photograph of the topsoil with the smeared clay removed shows slightly better aggregation than the main profile picture, but still less than T1.
Initial Profile Conclusion
Digging the soil profiles for the first time is always quite revealing. As I have dug soil profiles elsewhere on this farm, I was not surprised to find evidence of a plow pan at the same depth. That the residue is still evident years later indicates clearly that the soil's natural processes are not functioning to a high degree. Biologically active soil should consume those residues in a short period of time. That they are still there means that the conventional farming methods with plowing, monocultures, and chemical use have discouraged healthy soil development.
The decision to remove this field from the crop rotation and plant a perennial grass has already begun to repair the damage. The vigorous root systems of the grasses have been able to colonize down to the plow pan and even begin to send deep roots below this layer. Evidence of earthworm burrows, even if I did not see any earthworms themselves, is evidence that the halt to plowing is allowing soil biology to begin rebuilding the below ground infrastructure they depend upon.
The other results, like poor aggregation, similar root types, etc are simply more evidence that a monoculture of grass is not going to repair this damage much further. Although it is not even a sample size, T4's discovery of clover roots with nitrogen fixation taking place, are evidence that even a small increase in biodiversity can bring new functions to the system.
Generally what we hope to see in the future is that the relative size of the top two zones (1 green and 2 yellow) increase. We want more aggregation throughout the whole soil profile. I expect that if we are able to use subsoiling and biology to relieve the compaction layer present around 25cm deep that the introduction of functionally diverse plant roots into the system will see the Tree Lines and Margins improve most rapidly. How the alleys will change once we transition them back (successionally speaking) from perennial roots to annual roots remains to be seen.
Conventional Soil Testing (with micronutrients and reserves) & Near Infrared Spectroscopy (NIR) Soil Testing
We chose to send our soil samples for both conventional and NIR analysis to Eurofins Viljavuuspalvelu Oy based in Mikkeli, Finland. As mentioned in the introduction to this year's soil analysis, we had enough resources to send in two samples to be tested conventionally and with the NIR process.
What is written here is not a complete review of the analyses. Instead, I focus on some of the more interesting bits of information and how this knowledge is going to impact management. At times I make reference to the NIR analysis report, especially in the beginning. I have also tried to write as clearly as possible why each item is important for the soil, but it is important to understand that the interplay between different soil characteristics is very complex and there is no universally accepted way of interpreting them.
At the end of this section I will attempt a synthesis.
This link will open the PDF of the conventional test results hosted on Novia's website.
This link will open the PDF of Sample 1's NIR results hosted on Novia's website.
This link will open the PDF of Sample 2's NIR results hosted on Novia's website.
Conventional Testing
Overall, the two samples were similar, as one would expect, with differences primarily showing in the soil organic matter (SOM) classification as well as the amount of calcium, phosphorus, sulfur, and cation exchange capacity (CEC).
Soil Organic Matter
Sample 1, taken from more shallow soil that is also, comparatively speaking, from the field's margin, was placed in a lower SOM range which corresponds to 3-5,9%. Sample 2 was placed in the next band up: 6-11,9%. My interpretation, given the relative uniformity of the soil across the site determined by direct observation of the plants and soil profiles (above) is that we should take Sample 2's SOM score with a grain of salt.
I'm incredulous about the reported SOM in the conventional test also because Sample 2's NIR test gave the organic matter percentage of 3,7%. Sample 1, on the other hand, was 3,3% tested by NIR. I'm more inclined to believe the NIR sample because it is more consistent with observations and because its stated use is to get a better handle on soil carbon. Consider that the low end of the range given by the conventional test is 1,6 times greater than that reported by the NIR process. That is not a small discrepancy.
Whichever test more accurate, the soil organic matter for both samples is in my estimation low. We want to move the soils under our management firmly into the 6-11,9% range. It should be stated here that improving SOM for the sake of SOM is not our priority. We want the soil organic matter to improve through soil ecosystem improvement: more aggregates, more stable aggregates, and deeper topsoil formation. While it is good to have laboratory measurements of the soil organic matter as well as soil carbon, the quality of the SOM matters more than the sheer quantity.
pH
Both samples returned the pH at a measure of 5,3. This is firmly acidic. Conventional agronomic advice would be to apply lime in order to raise the pH. Can increasing biological activity in the soil through active support of functional biodiversity buffer the plants against the acidic state of the soil? This is what we want to find out.
One of the primary aims of our project is to test, in good faith, claims made by regenerative agriculture proponents (this includes the project leader) about the ability of sufficiently biologically active, "healthy" soils to support economically viable agricultural production. Some of the most recognized voices in regenerative agriculture claim that they do not recommend lime in almost any circumstances whatsoever. Instead, they focus on improving soil biological function. They say that improving the overall function of the system effectively renders liming unnecessary.
This is a big claim: modification of soil pH has been standard agricultural practice for a long time. The very real positive benefits from liming have been one of the cornerstones of agronomic practice for so long that questioning whether or not lime is necessary is tantamount to heresy.
Given that this is a pilot project intended, in part, to focus bioremediation of agricultural soils, foregoing lime would appear to be an extremely important thing to do. After all, if we were to apply the ±8 tons of lime needed to raise the pH into the mid 6 range, we would not be able to test the question for years after the fact. If, after a period of say 2-3 seasons using a holistic approach to soil health, the limiting factor in most need of addressing regarding plant performance can be identified as the soil's pH, we can make the decision to apply it.
Liming, therefore, is just like any other decision on the farm: it is a decision that must be tested against other options. We will test these other options first because we have the opportunity to fail. Please note that we are not necessarily claiming that we will see increases in soil pH over time without the application of lime. The only claim being made at this point is that we wish to test this idea in good faith. If we can avoid using lime- and still return the field to viable economic production- this will be an important step towards improving farm profitability as well as reducing the environmental impact of liming.
We do not recommend that other farmers believe our hypothosis and forego lime on their operations!
Calcium (Ca)
Both samples are low in available calcium (630 and 1000 mg/l respectively). The reserve of Ca reported by the conventional test returns 1500 and 1800 mg/l. The low levels of calcium are also reflected in the occupation of cation sites by calcium in lower than recommended values (32 and 36% reported conventionally). If we are to forgo the use of lime, which clearly imports calcium, how will we address this limiting factor?
It is operational understanding that calcium from the reserve can be made available to plants by a healthy soil biome. If it turns out that the plants are deficient in calcium despite efforts to stimulate and support a healthy soil ecosystem, calcium can be applied as a spray (foliar application, to the leaves). We will measure the uptake of calcium through plant sap analysis pulled from plants in each management area starting in 2023.
Phosphorus (P)
Available phosphorus levels are also quite low. Phosphorus is one of the "big three" macronutrients and the potential shortage of mined phosphorus in the coming decades is a cause of great concern. The majority of applied "synthetic" phosphorus has a tendency to become unavailable to plants very shortly after application. We can see from our conventional report that the reserve is from 50-80 times as large as the available pool. When investigated by NIR, the total phosphorus is yet even higher, even too high. If it is the case that we have over 3000 kg of P/ha in total reserves, could it be possible to make that available to plants through establishing healthy soil microbes?
After all, this is how "natural" ecosystems work. Plants support the soil microbes and fungi and they provide the plants, largely, with what they need. While not all "natural" soils have the same soil, it appears that most soils, in most places, are capable of supporting diverse ecosystems. We will attempt to make use of the phosphorus which is a natural component of the parent material as well as the P which has been imported to the system but become unavailable.
One of the main pathways for this work is to support the establishment of healthy mycorrhizal fungi populations and networks. The kinds of mycorrhizae which associate with most of our cultivated plants are quite sensitive to tillage and to overfertilization. If plants are supplied with readily available nutrients (especially N and P), plants often will refuse to form an association with the mycorrhizal fungi. Mycorrhizae are obligate organisms, meaning that they absolutely must have a plant partner for survival, and so the loss of energy from the plants means death. Unfortunately for us, mycorrhizal fungi are not simply providing N and P from a soil solution, but rather are active architects of healthy soil structure in and of themselves. So the loss of the partnership, in general terms, means that whole host of negative effects is set into motion by interfering with this symbiosis. In addition, those fungi which associate with our crops do not make above ground fruiting bodies and exhibit, for fungi, relatively slow growth rates. Therefore management which reduces their health or even kills them can have strong effects when repeated over decades.
Recent scientific conversation calls into question some of the claims about mycorrhizal fungi and the network effects in particular. However, it is well understood that mycorrhizal fungi play an important role in building health soils and in particular soil aggregation through the creation of biotic glues. It would be too early to dismiss symbiotic relationships that have developed over tens of millions of years.
Therefore we will be inoculating the initial seedings of the system with commercially available mycorrhizal fungi spores, of both endo (AM) and ectomycorrhizal species to help get the system started. This is controversial in some quarters, but we see the deliberate introduction of organisms as one step towards establishing a functioning soil ecosystem that has reduced need for outside input into the future.
Sulfur (S)
Sulfur is also low in both of our samples (9,2 and 5,9 mg/l respectively). I will avoid addressing this in detail here as I think that the NIR results are more intriguing. However, sulfur is one of the micronutrients that seaweed is capable of supplying. Similarly to Ca, we will be able to monitor the uptake of S by the plants throughout the season and see how foliar application of nutrients, including seaweed extracts, effect the system.
Cation Exchange Capacity (CEC)
The simplest way to understand CEC is that it is a measure of the soil's ability to bind nutrients. This is a gross over simplification, but in general the higher CEC of a soil, the more fertile it is. The soil's CEC is in large part determined by the kind of soil: sand, silt, clay and what proportion they are in. Clay soils tend to have the highest CEC ratings while sandy soils have the lowest. Given that our soils have a substantial, but not dominate clay fraction (±30%), the CEC of our soils should naturally be somewhere in between, befitting their classification as clay loams.
Soil organic matter and pH also have very important roles to play in determining the soil's CEC. Like with all these other soil characteristics it is not possible to provide a full treatment here, but suffice to say that while it is not feasible to alter the mineral soil of a farm, it is entirely possible to improve the soil organic matter's quality and quantity and thus improve soil fertility in this regard.
Our samples returned 10 and 14 cmol/kg respectively. This is the measure, again simply, of the number of "sites" that certain nutrients can bind to. It is low, but that is to be expected given the lack of soil organic matter. The total number of "sites" is important, but so too is how many of those sites are occupied. This is called base saturation. How saturated the CEC sites are with, in particular, calcium, magnesium, potassium, and some others such as sodium, hydrogen, and aluminium, is useful for understanding soil structure and nutrient availability. Our samples are, proportionally, under saturated by Ca and over saturated with Mg.
We will primarily address the poor CEC of our soils by increasing soil organic matter. Because we will attempt to provide supplemental nutrition to the plants based on what they need (determined through sap testing), we may see that over time the ratio of these nutrients changes in a favorable direction while the total capacity increases.
Near Infrared Spectroscopy (NIR) Testing
The soil used for both the conventional and NIR testing came from the same sample bag. This means that, although the two processes yield (at times) very different results, the materials analyzed are the same. The NIR report includes five pages of information, as such it is not reasonable to fully explain what has been reported. Some of the information is simply stated and not "analyzed" in the low-high range because there is not enough information available to make such statements yet. I think this is fascinating because it opens the door towards what we have yet to learn about soil!
Overall what is interesting, in comparing the results of the NIR to the conventional tests (which, again, you are not supposed to do), is how large the reserves of the major macro and micronutrients are when put through the NIR scan. A more granular differentiation between the two samples is also revealed. Sample 2, which corresponds more closely to the "core" of the field, has higher total nutrient reserves across the board, but not always better markers of soil health. For example, both samples score poorly on soil crumb structure, soil slaking, and wind erosion risk. [I have a short clip of wind erosion after a shallow tillage pass that I will upload at some point]
Because I mentioned some of the NIR results above, I will try to avoid the same territory and focus on some things that the conventional test does not measure or measures quite differently.
Nitrogen
Nitrogen is, even more so than phosphorus, the center of much controversy and worry. I have always found it interesting that the conventional soil analyses do not report back information about nitrogen given how important it is. So we are pleased that the NIR scan gives us an indication as to where we stand with Nitrogen in our system.
Please note that the results below are not indicating plant available nitrogen
Nitrogen is reported back as a total reserve, the soil's carbon to nitrogen ration (C:N), as well as the capacity of the soil to supply nitrogen. The total nitrogen reserves in the soil, according to the NIR report, are high: 4230 and 5210 kg N/ha respectively. I'll skip the C:N ratio, because its discussion can be saved for later, and turn the N supply capacity of the soil. In both cases the result is less or slightly less than the recommended range. It has been well reported in the scientific literature that nitrogen can continue to move through the soil profile and, worryingly, into water supplies for years after application has ceased. With this in mind, as well as knowing how available nitrogen negatively affects a plant's participation in the soil food web, we are put in a position where nitrogen applications need to be made with great care.
If the field has high levels of nitrogen, but not enough capacity to release it, once again we turn to soil biology as the primary means of making this nitrogen available to the plants. Except for the nitrogen that came with the horse manure compost, we do not plan to apply more nitrogen directly to the soil in any quantity. Compost and seaweed extracts (and teas, potentially) applied as seed treatment and possibly in furrow, will have available nitrogen in them, but they are applied at extremely low rates and do not compare to what is typical for a fertilizer input. Just like the other nutrients, it is possible to supply nitrogen to plants directly through a foliar application, so this is the route that we plan use to supplement the system if necessary.
Lastly, I will add that even before these results showed just how much nitrogen is in the system, we have been considering how to avoid the overuse of legumes in our cover crop mixes. Legumes are extremely useful plants, but they also can reduce the total amount of nitrogen available in the soil system- according to some research and anecdotal evidence from regenerative farmers. Once again we are plotting out a management regime that differs radically from conventional wisdom because such a departure is built into the core objectives of the pilot project.
Similarly to liming, we are not recommending that farmers switch almost exclusively to low dosage foliar applications of nitrogen.
Organic Matter and Carbon
Information directly related to SOM and soil carbon is provided four ways: organic carbon, organic matter, carbon to organic matter ratio (C:SOM), and clay to carbon ratio. As mentioned in the conventional section, these measures of carbon and SOM are different for Sample 2. According to the NIR test, both soils are between 3,3 and 3,7% SOM. The C:SOM ratio is almost identical at ±0,65. According to the scale, this is a little high.
One might ask: if carbon is so important, how can there be too much of it in relation to SOM? The answer is of course complicated, but it may be useful to think of soil carbon as the stable portion of SOM. This is precisely how the NIR report, on page 3, reports the "quality" of the soil organic matter. Both of the soils have, then, have a larger proportion of stable SOM. While it is good to have stable organic matter in the soil (carbon), it is also very important to cycle carbon. Microbes need carbon as food and they respire plenty of CO2 into the atmosphere at the soil surface: the "gas" exchange capacity of the soil (respiration) is an important measure of how active the soil biology is. This is something we are not currently equipped to test, but I am mentioning it here because the story of soil fertility is not "sequester as much carbon as possible and keep it there forever." Over long periods of time it is often a proper goal to increase total soil C, but it cannot be done at the expense of the soil ecosystem's need for carbon based energy, or what they call "dynamic" soil organic matter.
Therefore we want to increase the total amount of soil organic matter in the system, but not by necessarily importing more from outside; rather we are focused on supporting the crops so that they photosynthesize to a high degree and fix atmospheric carbon in situ. Soil health practices and management of the plants at different stages of their life cycles is important in this. We are still new to applying these principles at scale, but learning the patterns of the system is also an important element in producing useful information for other farmers.
Soil Biology
With our focus on biology, it is very useful that the NIR test reveals information about total microbial biomass, the soil life's activity level, and the bacteria to fungal ratio of the soil. While farmers do not get paid for soil microbes, soil microbes play such a large role in providing plants what they need (as well as additional ecosystem services such as improving immune function and water use efficiency), that having laboratory measures of their general characteristics can be a useful tool for interpreting the rest of the soil report. The total amount of biomass in the soil and the rough bifurcation into bacteria and fungi serves as a good measuring stick of how effective our cropping system is in turning solar energy into biology.
This will also help put into persepective the soil organic matter, the nutrient release capacity of our soils, and why we did not see very good aggregation when we visually observed the soil. Both samples returned what I consider to be "extremely low" total biomass: 240 and 205 mg C/kg respectively. These numbers are tiny. A healthy soil at the height of summer should have much greater total microbial biomass. For comparison's sake, my old farm registered 1734 mg C/kg, or 7,7 times, as much microbial biomass from a sample taken in late November. The total activity of those microbes was 3-4 times as much even as winter was setting in: weather and seasonality play very important roles in soil microbe populations. Yet, even more than a month after the effective growing season had ended, soils cared for with no-dig, diverse cover crops, and attention to soil health in general were still incredibly active.
While comparing no-dig market gardening with compost and diverse cover crops to a large scale conventional farm is like comparing apples to oranges, the point that I am making is that soils can be much, much more active. So this is where the "low, a little low, good, a little high, high" rating system breaks down for me on this NIR test. As I said above, I don't consider soils with 3-4% SOM as having sufficient biological activity. Therefore the total biomass in these samples entering the "good" category on the NIR scan is off target. To be fair, these ratings are based on large scale databases and they are comparing the sample to itself. The laboratory is not putting your soil sample into a competition with other soils. Even so, I simply cannot think that this is "good."
The activity levels of the biomass that is there, however, tells a better story I think. Similarly to SOM and soil carbon, we aren't so interested in just having a lot of "stuff," in this case, microbes, hanging around doing nothing. They need to be active. So the return of 43 and 28 mg N/kg on the activity levels being ranked low and a little low, is more revealing of the actual state of affairs. It makes sense that the NIR scan tells us that the activity is low because we can see the some of results of low soil biological activity with the naked eye: both by looking at the soil profile and examining the health of the plants that are growing there. Of course, high activity doesn't necessarily mean good activity either, but like with everything we need perspective.
The last figure provided by the tests under biology is a fungal to bacteria ratio. This is another place where your perspective on what healthy soil is will play a big role in interpreting the figures. Our samples returned 0,7 and 1,2. That means for Sample 1 that we had more bacteria than fungi, which is to be expected given the site's history: conventional approaches to farming with tillage, fungicides, and a general lack of organic material being cycled through the system naturally reduce fungal populations. On the other hand, Sample 2 had more fungi than bacteria.
In this case, the recommendation for how to consider this ratio is also based on what crop you said you wanted to plant next. Oddly, Sample 1, which we indicated we'd want to plant apples, says that 0,7 is good. Most regenerative farmers I listen to speak to wanting more fungi than bacteria in perennial systems, especially those with trees. I personally wouldn't consider 0,7 good. Parity or greater than 1 would be better.
With Sample 2 we indicated that we'd want to plant pasture seeds (nurmisiemenet) which kind of accurately describes the diversification, but not quite. Still, here it says 1,2 is on the verge of being high. That can make sense, but there is one more thing to think about. A thought experiment follows:
Imagine that you are responsible for hosting a convention. You have the space to suit thousands and thousands of vendors and customers. Only a few hundred show up and the convention operates at a loss. Afterwards, you are asked what the ratio between men and women was. Or "Adults:Children" if you prefer, any binary category for people will do. You do the math and your supervisor says, well "that's good!" Was it, though?
You had the capacity and the need for tens of thousands of people to attend your convention in order to be a success. What does the ratio of a binary category of the few people who showed up have to do with anything when the convention failed? Not much.
This is also how I interpret the results of our biology scores. We don't have enough microbes, and those we do have are quite inactive, to begin making heads or tails of the relationship between those who are there. The lack of biology, then, ties back to the availability (or lack thereof) of all the other nutrients whose uptake by plants is, evolutionarily speaking, tied to functioning relationships with microbes. In the paradigm we are operating in, the soil biology is the key figure to understand if we want to interpret the rest of the results.
Finally, I do not see the inclusion of numbers that mean little as a fault. It isn't wrong to do the math and provide insight. We did not pay for additional consulting from Eurofins to help interpret these results. They very may well say some similar things about these samples as I have written here (or, not). The reason I spend so much time and effort examining these reports this way is to drive home how differently we see things in this project from standard practice. Context is paramount: if someone wants to know why we chose to do things the way we did, we have a record of how the information we had at hand was interpreted. When things go wrong, and they will, we have a record to return to and say: here, this is a place where our idea went wrong. That's the start of transformation.
Soil Food Web Analysis
This link will open the PDF of Sample 1's Soil Food Web results hosted on Novia's website.
This link will open the PDF of Sample 2's Soil Food Web results hosted on Novia's website.
Now we can turn to the final soil analysis that was performed as a benchmark for 2022, the Soil Food Web Assessment. We reached out to Uoma vulgaris avoin yhtiö to provide this service. Although there is a risk of confirmation bias in using this method, the benefit is that the assessment expands the level of detail from the bifurcation made by the NIR analysis of microbes as "fungi" and "bacteria." Please note that the results will not correlate in a statistically valid way; however, for an applied project like ours, the trends and patterns of change are what we are interested in. Do the same trends and patterns appear across different means of assessment? If we can measure, or apprehend, similar changes using different tools and methods, the more likely it is that the changes detected are fairly representing what is taking place in the soil.
The Soil Food Web Assessment has four sections: beneficial organisms, detrimental organisms, comments, and photographs. What I want to call attention to in these reports is the dearth of biodiversity in the soil. The total estimated bacterial biomass for both samples is reported as "very high." Otherwise the pattern is: "none observed" or "one observed." These population trends hold true across the beneficial and detrimental organism divide.
In the comment section, the analysis presented- from both samples- is "The sample was dense with both mineral particles and bacteria, which is a sign of a lack of structure in the soil. This lack of structure and low organic matter mean there is a lack of habitat for a diverse food web to establish." This characterization is in line with my previous on farm observations from digging soil profiles. Of course I was unable to make the assessment about the bacteria, but through proxy observations of rooting depth, soil macro fauna, and soil aggregation, I was able to extrapolate that "there is a lack of habitat for a diverse food web to establish."
This observation in the analysis is key to understanding how we want to approach the system: using biodiversity from multiple kingdoms, we want to improve the conditions for the natural soil ecosystem to develop. The soil food web functions the same way that whole terrestrial ecosystems do: the trophic layers of the system are based on energy input from plants. Only through cultivating a wide range of functionally diverse plants and allowing their roots and soil associates to do the work of physically constructing aggregates will there be both food and habitat for the rest of the food web to subsist on.
Our expectation is that through seed inoculation and biodiverse plants, that we will see quite rapid changes in the Soil Food Web Analyses over the course of 2023. While it will more likely take time to move the needle on total soil organic matter and other indicators of soil health, the changes in population size and ratios of the microbes is something we can likely detect soon.
Lastly, the fungal to bacteria ratio (F:B) reported by the Soil Food Web Assessment is entirely different from the NIR test. Instead of 0,7 and 1,2, direct microscopy says we are working with F:B ratios of 0,005 and 0,012. I am not worried that the F:B assessment of the soil is completely different from these two methods because, as I explained in the above section on this, the total biological activity is so low.
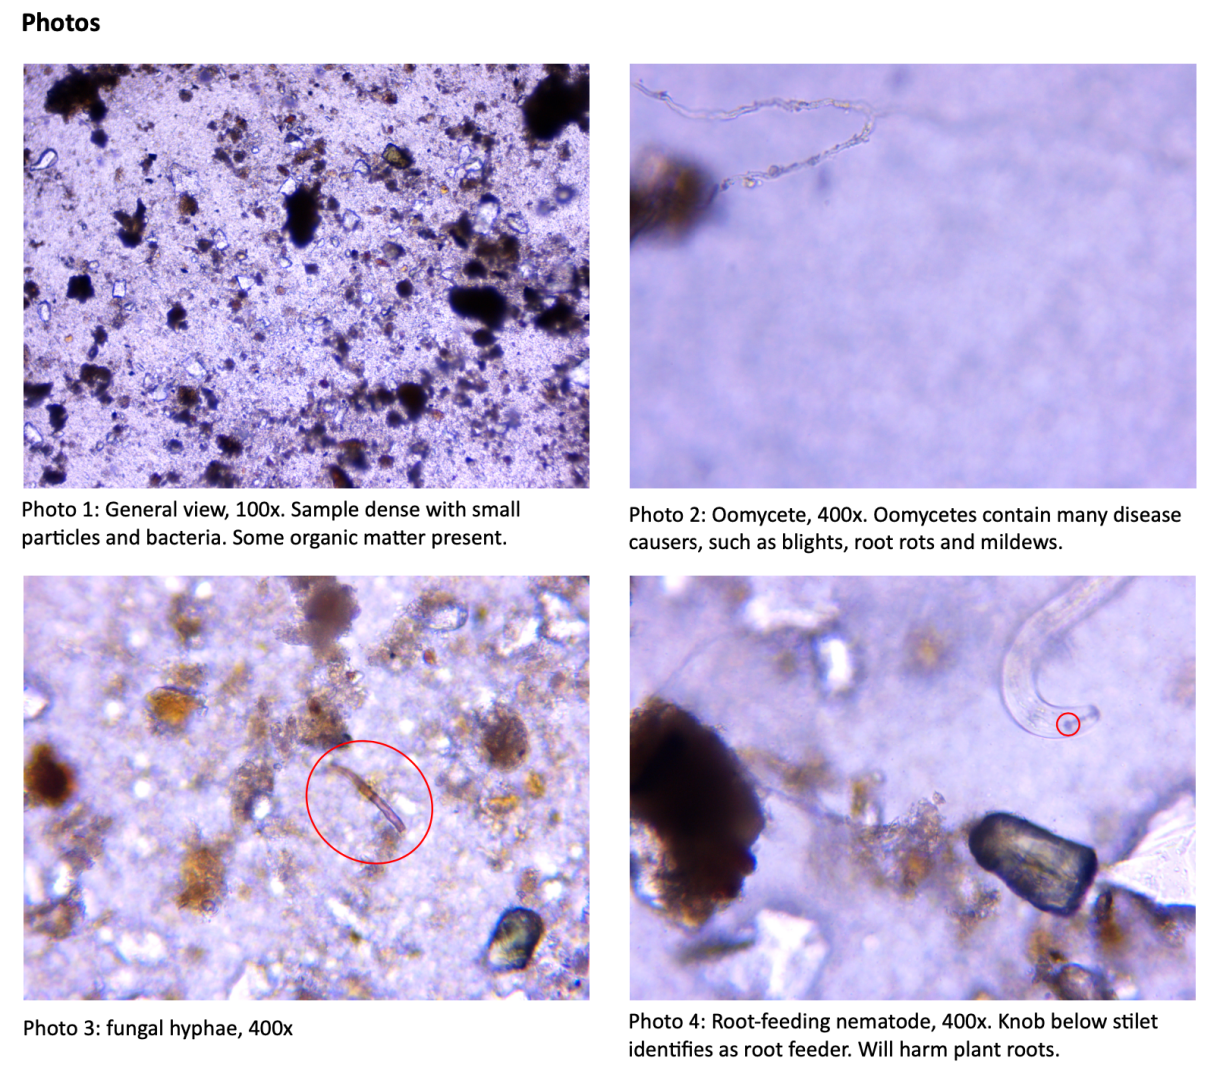
Photographs from Sample 1's Soil Food Web Assessment. Photographs by Kimmo Englund, Uoma vulgaris
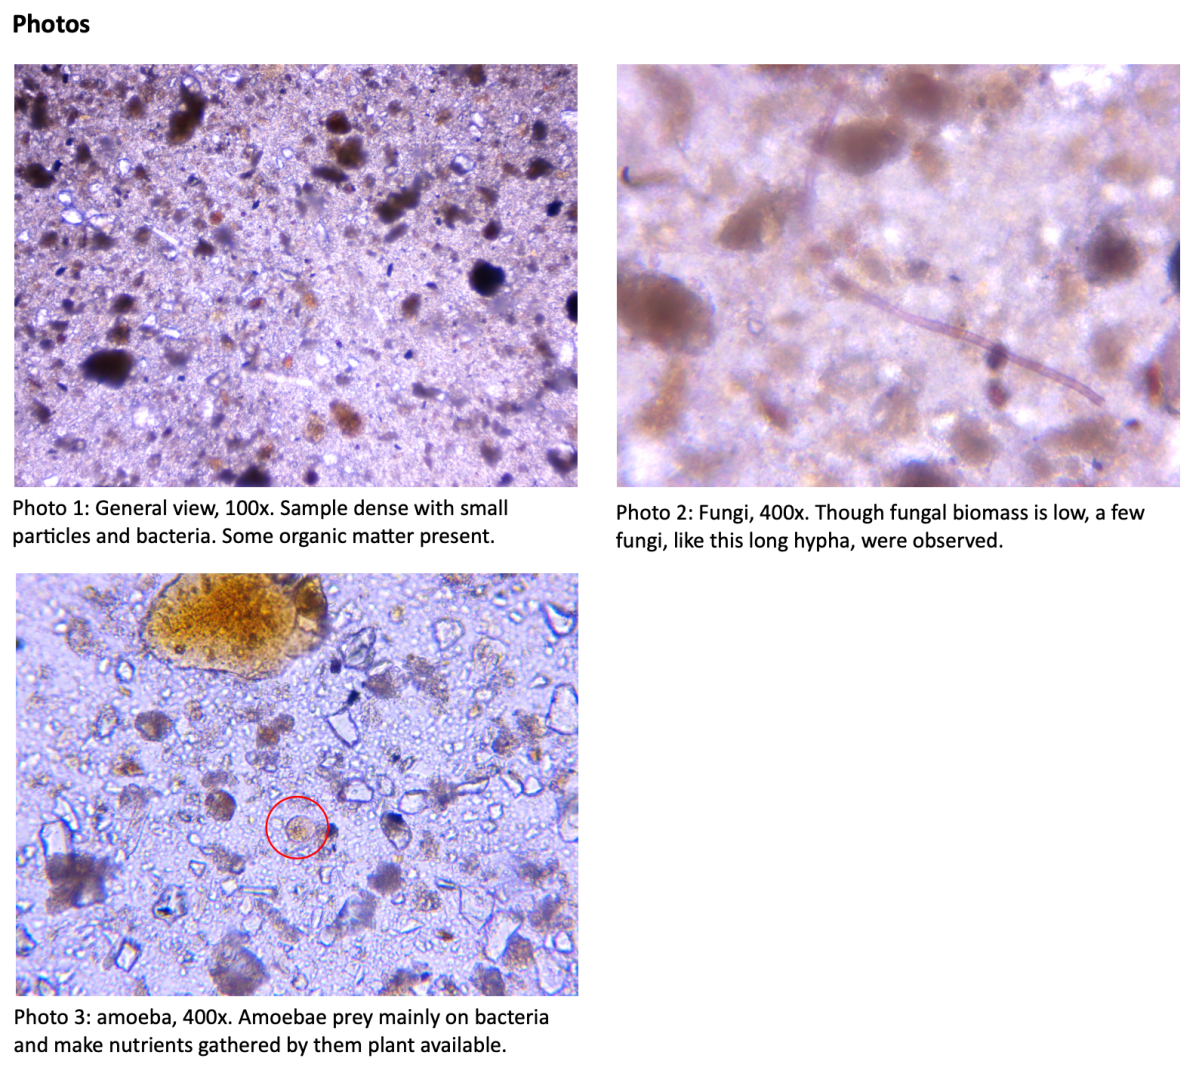
Photographs from Sample 2's Soil Food Web Assessment. Photographs by Kimmo Englund, Uoma vulgaris
